Make Use of Your Survey Data – Kano Them!
Nearly all medium-size and large companies spend hundreds of thousands or even millions on customer surveys every year. Customer survey results serve to amend strategies, design new products and services and focus improvement activities. Gathering customer survey data is only the first step.
The second step involves making best use of the expensive data, analysing them, drawing business relevant conclusions and making important decisions. How are we doing in this step?
Basic Analysis
A Home Appliances manufacturing company called upon their staff in the Customer Care Department to analyse new satisfaction data and to suggest actions to the management team.
All satisfaction data have been gathered using a four-point Likert scale for satisfaction and “Buy Again” and a five-point Likert scale for “Recommend”, i.e., somewhat a Net-Promoter-Score.
Some conclusions are obvious immediately:
- Overall satisfaction seems to have dropped.
- Tendency to buy again and to recommend have gone down as well.
- Product Quality seems to be stable at a high level whereas Sales Quality is lower but stable. Delivery Quality has dropped.
- The major driver for satisfaction seems to be Product Quality with Delivery Quality following.
Calculating confidence intervals for all results has proven significance of all changes. This means, it makes sense to conduct more detailed analyses to find the culprit for the drop in Delivery Quality. Looking into the four major drivers for Delivery Quality revealed that Cleanliness and Punctuality leave room for action.
The question is: Does improving Cleanliness and Punctuality really drive the ultimate goal, i.e. repetitive business from existing customers and them recommending the company to their friends? The data may suggest it.
However, can we really be sure about this?
Kano Analysis
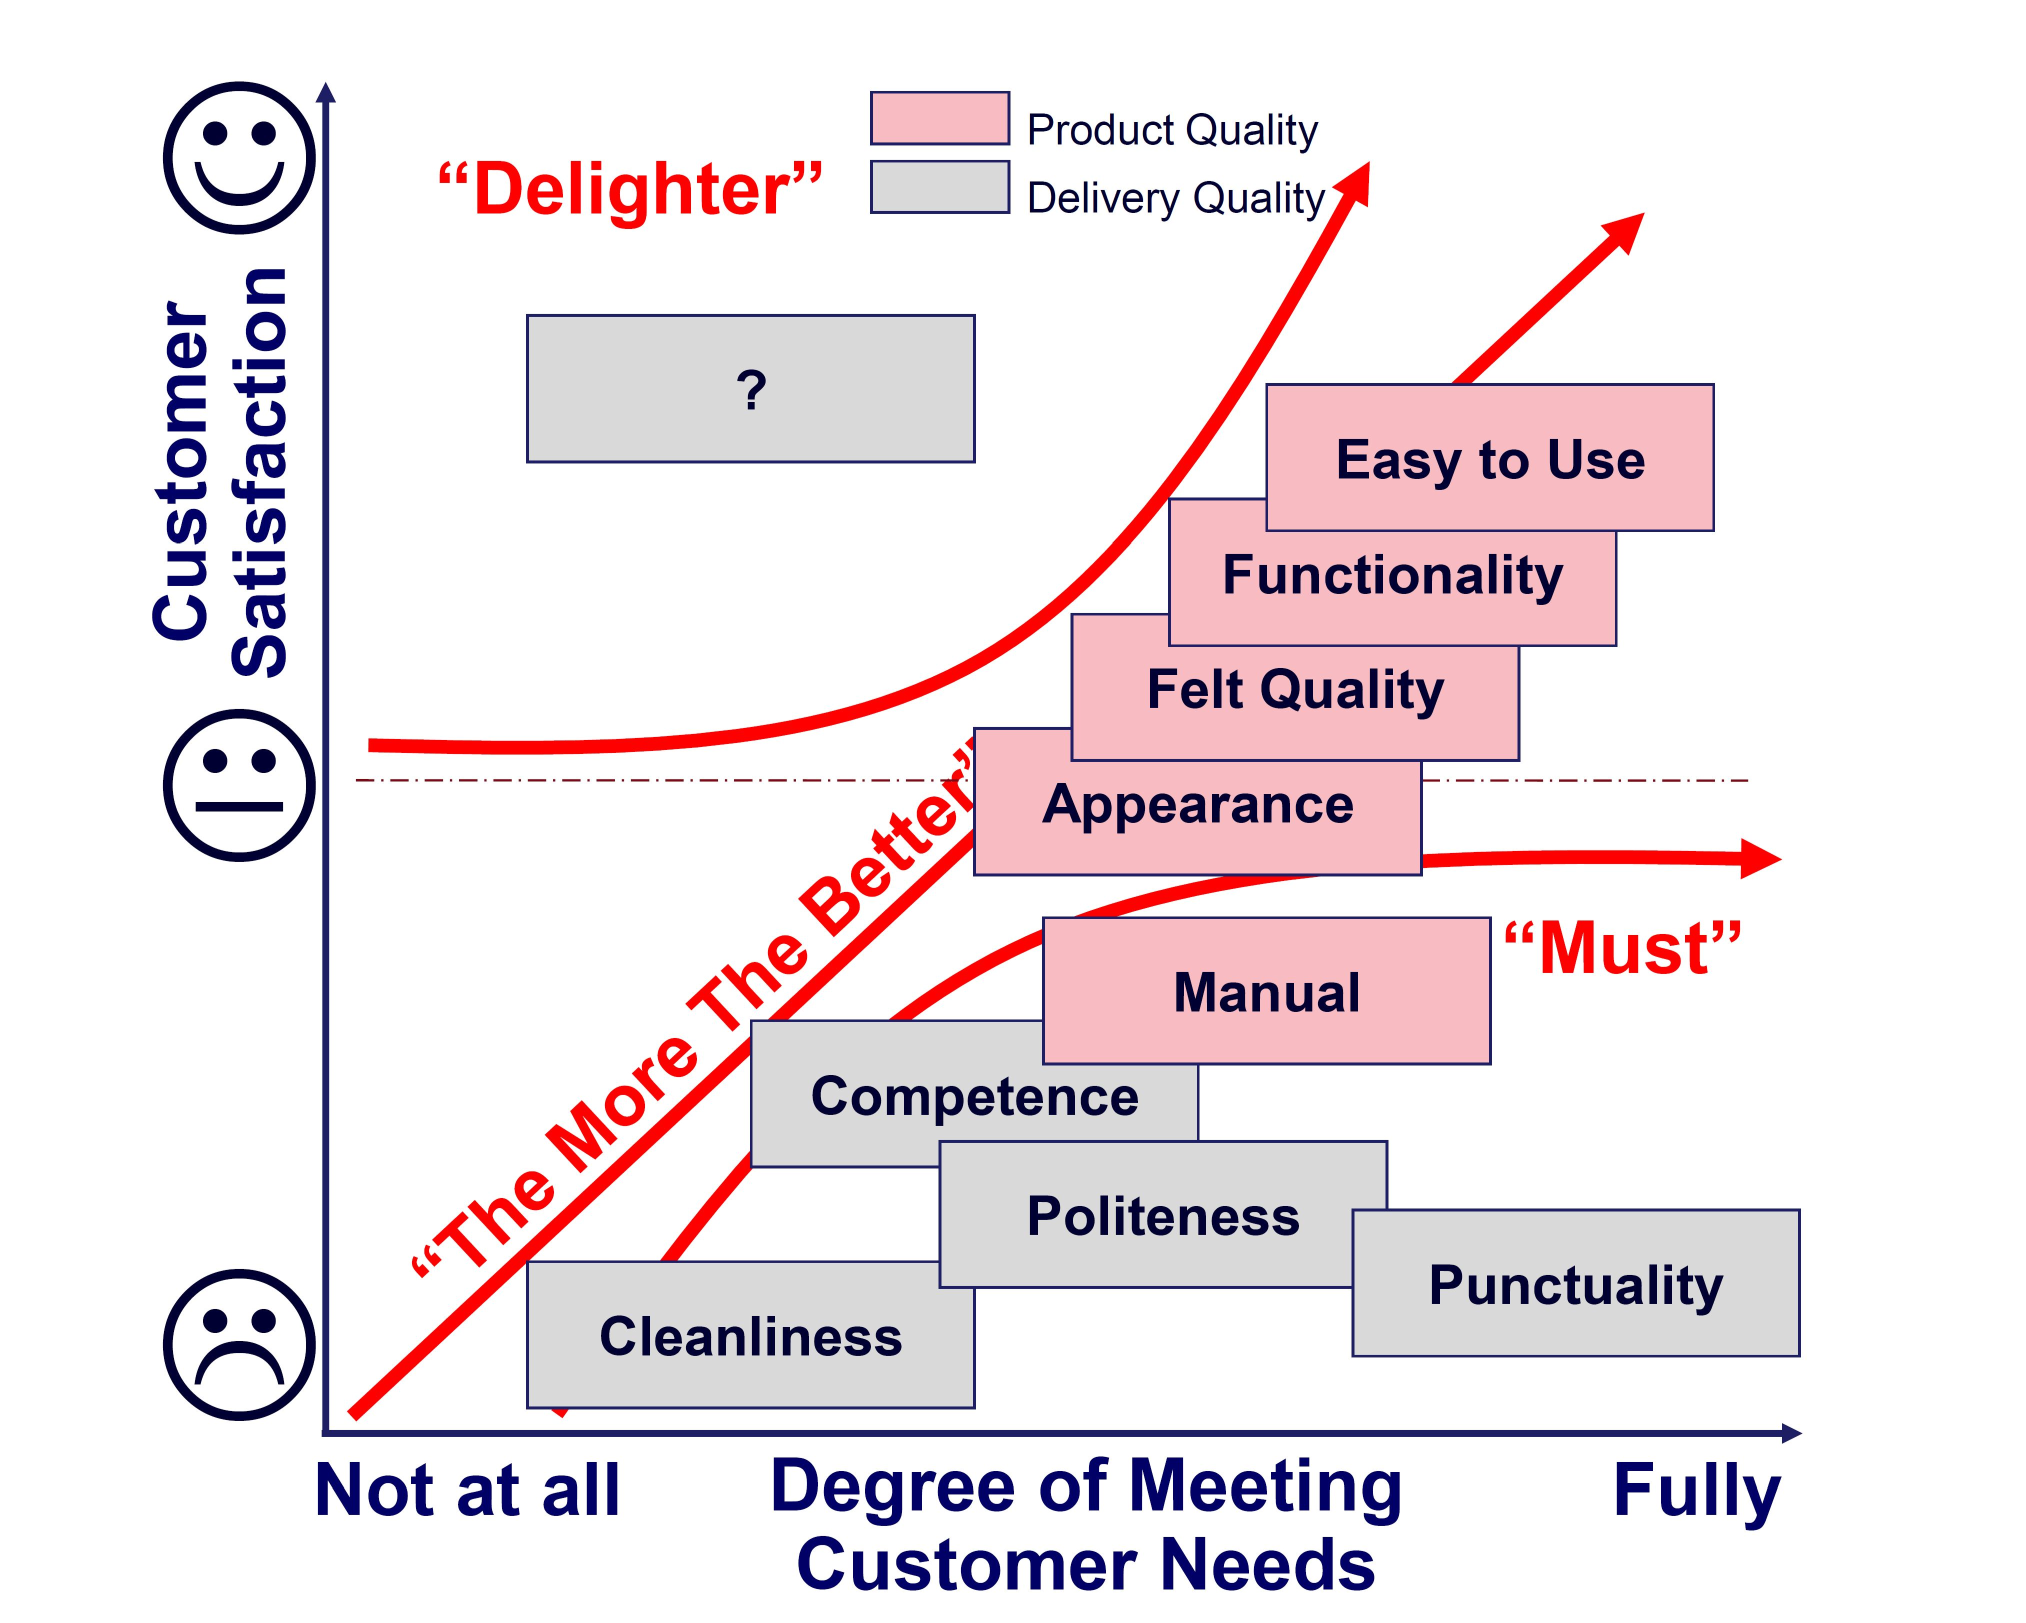
Kano Analysis is a tool – often mentioned in Lean Six Sigma trainings, not so often applied in projects – that can greatly help to structure customer needs based on feedback given.
It divides customer needs in four categories:
- Must: Customer expects this characteristic to be fulfilled, even without talking about it. However, fulfilling this need does not result in customer satisfaction, it just avoids dissatisfaction. Example: Your new car comes with aircon – if you buy it in Singapore.
- The More the Better: Not meeting this need results in dissatisfaction. Delivering on this requirement generates satisfaction – the more the better. Example: Fuel efficiency of a car is of great interest for most customers.
- Delighter: Customer does not expect meeting this characteristic; hence it does not result in dissatisfaction if not present. However, this characteristic can be used to differentiate your product or service in the market, to form a unique selling point. Example: Receiving your new car with ten years free warranty would be far beyond your expectations.
- Indifferent: Customer does not perceive this characteristic as necessary nor does it cause satisfaction if present. Example: Car manual shows an additional, a foreign language.
Information about these categories of customer perception for our product and service will be of enormous value for improving performance and gaining market share.
How can we use our customer satisfaction data to establish a Kano analysis? The so called Jaccard Index of Similarity gives the answer.
Jaccard Analysis to Support Kano
Paul Jaccard developed an algorithm that enables regression-like comparison of non continuous data such as a Likert Scale.
Additionally, this algorithm is able to filter “Musts”, “The More The Better” and “Delighters” out of the data.
This enables the following conclusions:
- As expected, Cleanliness turns out to be a Must together with Punctuality, Competence of Staff and Punctuality. I.e. these characteristics are expected, they are basics.
- Fulfilling Cleanliness and Punctuality indicators will not get higher customer retention nor will they drive the Net-Promoter-Score. Working on these characteristics only is not enough.
- Product Quality during and after delivery and installation are seen as satisfiers, or: the more we offer the happier the customer will be. Working on these characteristics is essential to drive sales.
- However, none of all 18 indicators over all categories is able to “delight” our customers. We don’t have a unique selling point. As soon as our competitors come out with the iPhone under the dishwashers, we will loose market share.
Conclusion
Customer Satisfaction Data are not easy to come by. Therefore, it is self-explaining that we must make full use of these data.
By appointing your Data Analysts or your Green or Black Belts to run analysis of the data helps avoiding wrong decisions.
Additional value can be added with tools like the Kano diagramme that is beyond the standard toolbox of many market researchers. Instead of relying on them for this analysis, we recommend to use your own Data Analysts to gain flexibility and save costs.


