Can We Predict When Our Staff Is Leaving?
Analysing and Predictive Modelling of Staff Turnover
During the monthly management meeting, the new Sales Director, let’s call him Donald, is trying to learn more about his new employer and asks many questions. As it is HR’s turn, his question is about the annual staff turnover. “About 29% annually” answered the HR Director, Susan. Donald did not comment since he did not want to put his new colleague in an awkward position. After the meeting, he took Susan aside and asked her: “As far as I know this is a bit on the high side, right?” Susan knew her stuff too and nodded to his comment.
Understanding the Business Problem
UK
- What are the drivers for staff turnover?
- Can we predict staff attrition, i.e. who is at high risk of leaving?
- How can we reduce the attrition to less than 15%?
Getting the Data

UK
Preparing the Data

Analysing the Data
As the outcome variable “Left” is discrete with only two levels, left or stayed, the analysis needs a “special” set of tools. Since the limits of MS Excel with its ToolPak are easily reached with this kind of analysis, the powerful analysis and visualisation software R was deployed.
Business Travel
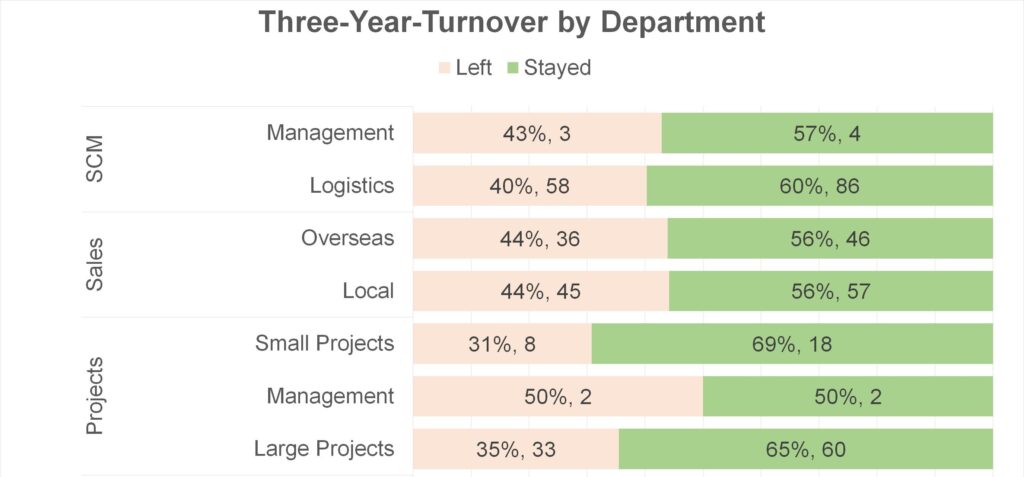
Organisational Units
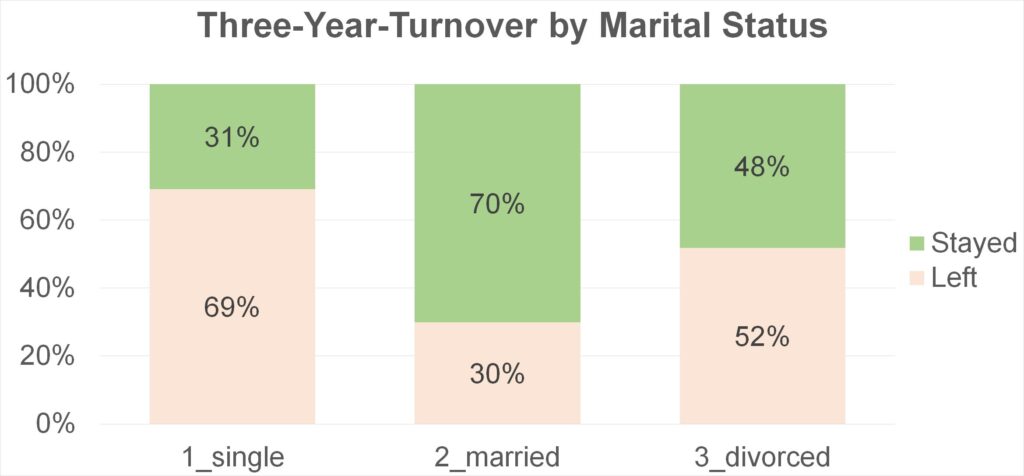
Marital Status
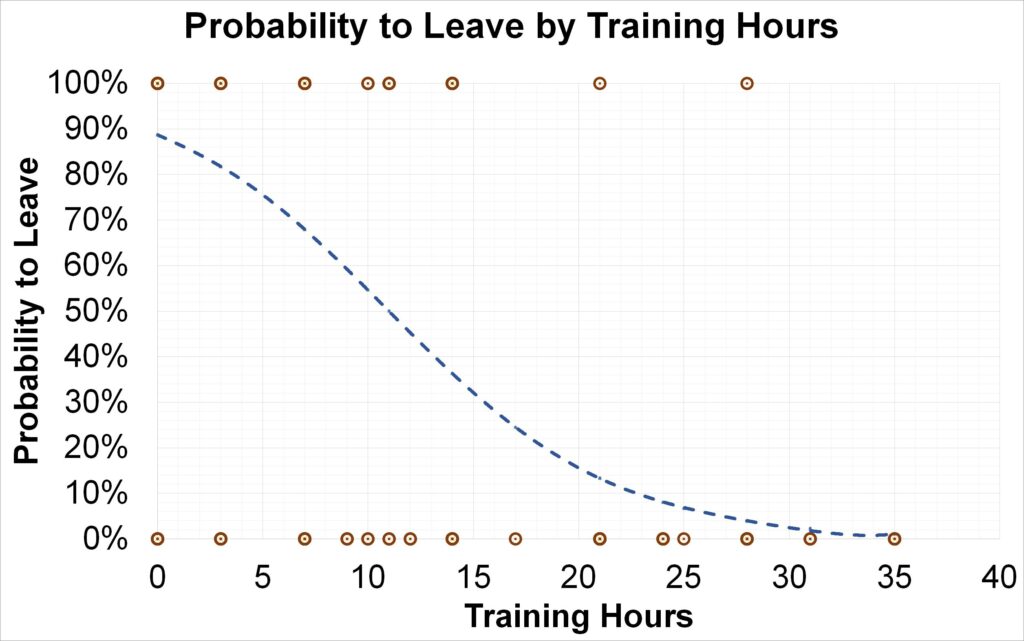
Training Hours
Always combine graphical with statistical analysis. Relying on only one of them might be a mistake.
UK
Designing a Model
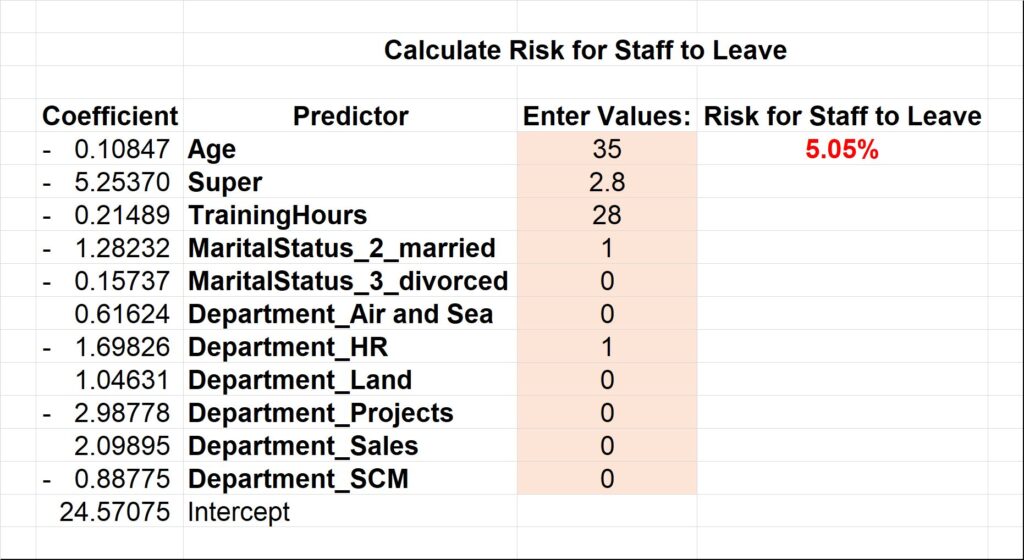
Predicting the Probability of Staff to Leave
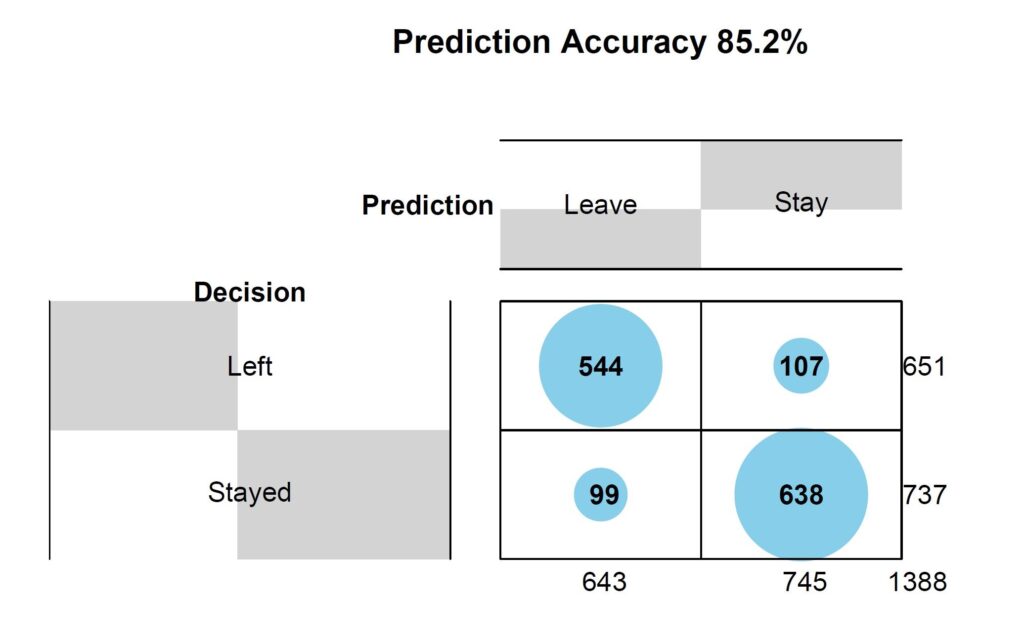
Calculating Prediction Accuracy
Setting Your Priorities
Making a Business Decision
Summary
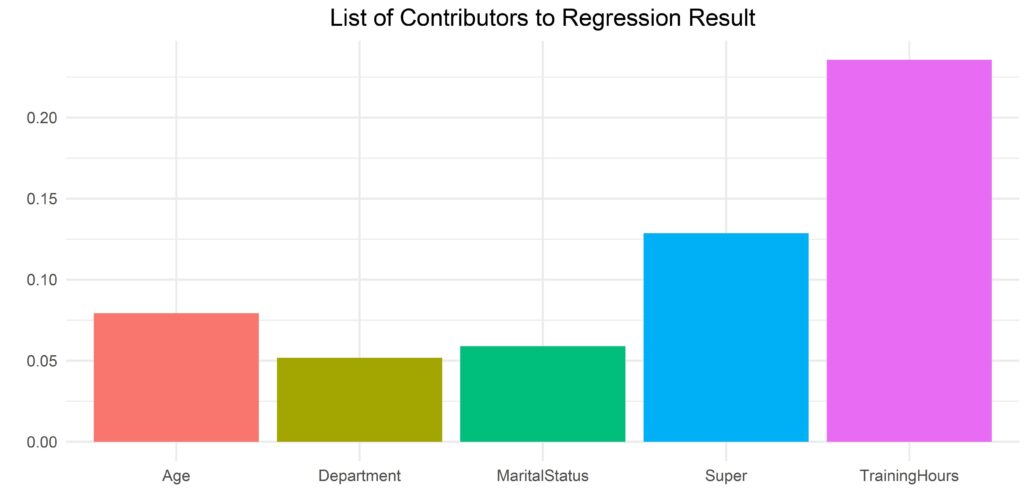
- Lack of development options, especially training, provided to them. If we were able to provide a career plan and attractive development options to staff, we would have a very high chance to keeping them longer (Tan, 2014). There is a caveat. It could also be, that supervisors do not invest development options in staff who seems to be on the lookout for other jobs. Statistics will not be able to inform about the direction of the correlation between variables Training-Hours and Left.
- Inadequate supervisory practices (Tan, 2020).
- Younger staff are more likely to leave than older staff.
- Singles are more likely to leave the organisation than married or divorced staff.
- There is a difference in turnover from department to department. Drivers are probably to be found in employee engagement survey results.
The Impact
Summary
The Impact
If you wish to download the complete set of data for this staff turnover case and follow through each analysis step you might want to get Data Analytics for Organisational Development.
If you want us to lend a hand in your analysis, get on your Zoom and contact us. We will be there for you.