Get a Quote

Data Analytics

Introducing Data Analytics and Data Science into Your Organisation with Carefully Crafted Solutions.

“I only believe in statistics that I doctored myself.” Winston Churchill

Data analytics, or data analysis, is the process of screening, cleaning, transforming, and modeling data with the objective of discovering useful information, suggesting conclusions, and supporting problem solving as well as decision making. There are multiple approaches, including a variety of techniques and tools used for data analytics. Data analytics finds applications in many different environments. As such, it usually covers two steps, graphical analysis and statistical analysis. The selection of tools for a given data analytics task depends on the overall objective, the source and types of data given.

Above all, Data Analytics, as part of Data Science, marks the foundation of all disciplines that are part of Artificial Intelligence (AI).

Objectives of Data Analytics

The objective of the data analytics task can be to screen or inspect the data in order to find out whether the data fulfils certain requirements. These requirements can be a certain distribution, a certain homogeneity of the dataset (no outliers) or just the behaviour of the data under certain stratification conditions (using demographics).

More often than not, another objective would be the analysis of data, in particular survey data, to determine the reliability of the survey instrument used to the collect data. Cronbach’s Alpha is often applied to perform this task. Cronbach’s Alpha determines whether survey items (questions/statements) that belong to the same factor are really behaving in a similar way, i.e. showing the same characteristic as other items in that factor. Testing reliability of a survey instrument is a prerequisite for further analysis using the dataset in question.

Data Preparation Before Data Analysis

Often enough, data is not ready for analysis. This can be due to a data collection format that is not in sync with subsequent analysis tools. This can also be due to a distribution that makes it harder to analyse the data. Hence, reorganising , standardising or transforming (to normal distribution) the dataset might be necessary.

Data Analytics with Descriptive Statistics

Descriptive Statistics includes a set of tools that is used to quantitatively describe a set of data. It usually indicates central tendency, variability, minimum, maximum as well as distribution and deviation from this distribution (kurtosisskewness). Descriptive statistics might also highlight potential outliers for further inspection and action.

Data Analytics with Predictive Statistics

In contrast to descriptive statistics characterising a certain given set of data, inferential statistics uses a subset of the population, a sample, to draw conclusions regarding the population. The inherent risk depends on the required confidence level, confidence interval and the sample size at hand as well as the variation in the data set. Hence, the test result indicates this risk.

Data Analytics with Factor Analysis

Factor Analysis helps determine clusters in datasets, i.e. it finds empirical variables that show a similar variability. These variables may therefore construct the same factor. A factor is a dependent, unobserved variable that includes multiple observed variables in the same cluster. Under certain circumstances, this can lead to a reduction of observed variables and hence the increase of sample size in the remaining unobserved variables (factors). So, both outcomes improve the power of subsequent statistical analysis of the data.

Factor analysis can use different approaches to pursue a multitude of objectives. Exploratory factor analysis (EFA) is used to identify complex interrelationships among items and determine clusters/factors whilst there is no predetermination of factors. Confirmatory factor analysis (CFA) is used to test the hypothesis that the items are associated with specific factors. In this case, factors are predetermined before the analysis.

Data Analytics For Problem Solving

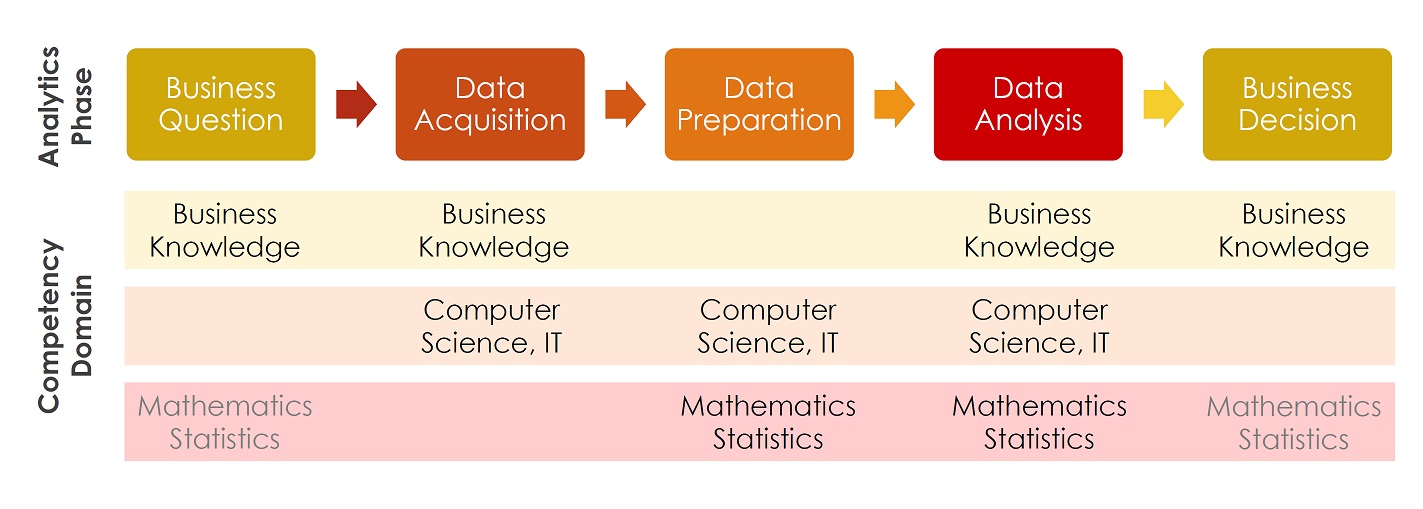
Data analytics can be helpful in problem solving by establishing the significance of the relationship between problems (Y) and potential root causes (X). As a result, a large variety of tools is available. The selection of tools for a given data analytics task depends on the overall objective, the source and types of data. Discrete data, such as counts or attributes require different tools than continuous data, such as measurements. Whilst continuous data are transformable into discrete data for decision making, this process is irreversible.

Depending on the data in X and Y, regression analysis or hypothesis testing will be used to answer the question whether there is a relationship between problem and alleged root cause. These tools do not take away the decision, they rather tell the risk for a certain conclusion. The decision is still to be made by the process owner (example).

Analytics was never intended to replace intuition, but to supplement it instead.
Stuart Farrand, Data Scientist at Pivotal Insight

Conclusion

Applications for data analytics are evident in all private and public organisations without limits. For example, already some decades ago, companies like Motorola and General Electric discovered the power of data analytics and made this the core of their Six Sigma movement. As a result, these organisations made sure, that problem solving is based on data and applied data analytics wherever appropriate. Nowadays, data analytics or data science is vital part of problem solving and most Lean Six Sigma projects. So, Six Sigma Black Belts are usually well-versed in this kind of data analysis and make good candidates for a Data Scientist career track.

Training

To sum it up, we offer multiple training solutions as public and in-house courses. Please, check out our upcoming events.

Privacy Settings
We use cookies to enhance your experience while using our website. If you are using our Services via a browser you can restrict, block or remove cookies through your web browser settings. We also use content and scripts from third parties that may use tracking technologies. You can selectively provide your consent below to allow such third party embeds. For complete information about the cookies we use, data we collect and how we process them, please check our Privacy Policy
Youtube
Consent to display content from - Youtube
Vimeo
Consent to display content from - Vimeo
Google Maps
Consent to display content from - Google
Spotify
Consent to display content from - Spotify
Sound Cloud
Consent to display content from - Sound