A better method is ANOVA (analysis of variances), which is a statistical technique for determining the existence of differences among several population means. The technique requires the analysis of different forms of variances – hence the name. But note: ANOVA is not a test to show that variances are different (that is a different test); it is testing whether means are different.
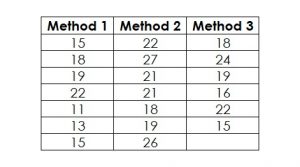
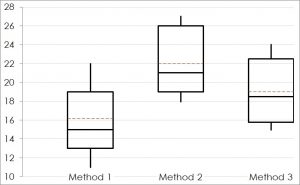
1. Plot the Data
2. Formulate the Hypothesis for ANOVA
In this case, the parameter of interest is an average, i.e. the null-hypothesis is
H0: μ1 = μ2 = μ3,
with all μ being the population means of the three methods to dissolve the powder.
This means, the alternative hypothesis is
HA: At least one μ is different to at least one other μ.
3. Decide on the Acceptable Risk
4. Select the Right Tool
If there is a need for comparing more than two means, the popular test for this situation is the ANOVA.
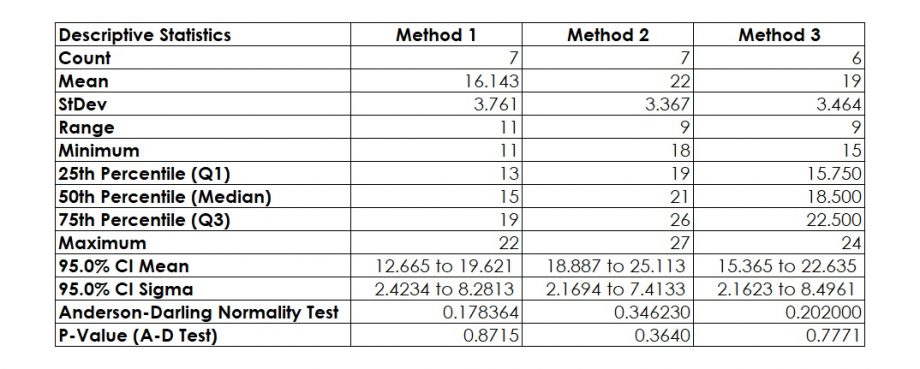
5. Test the Assumptions
- All data sets must be normal and
- All variances must not be significantly different from each other.
6. Conduct the Test
Since the p-value is 0.0223, i.e. less than 0.05 (or 5 percent), we reject H0 and accept HA.
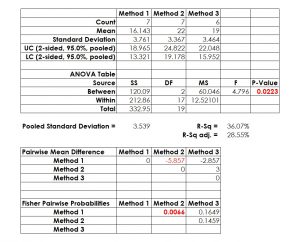
7. Make a Decision
Interested in the stats? Read here.