Companies invest millions in customer surveys—but too often stop at collecting data. The real value lies in analysing survey results to uncover actionable insights.
Collecting survey data is only step one. Step two – statistical analysis – is where the real value emerges.
How are we doing in this step?
Basic Analysis: What We Learn Quickly
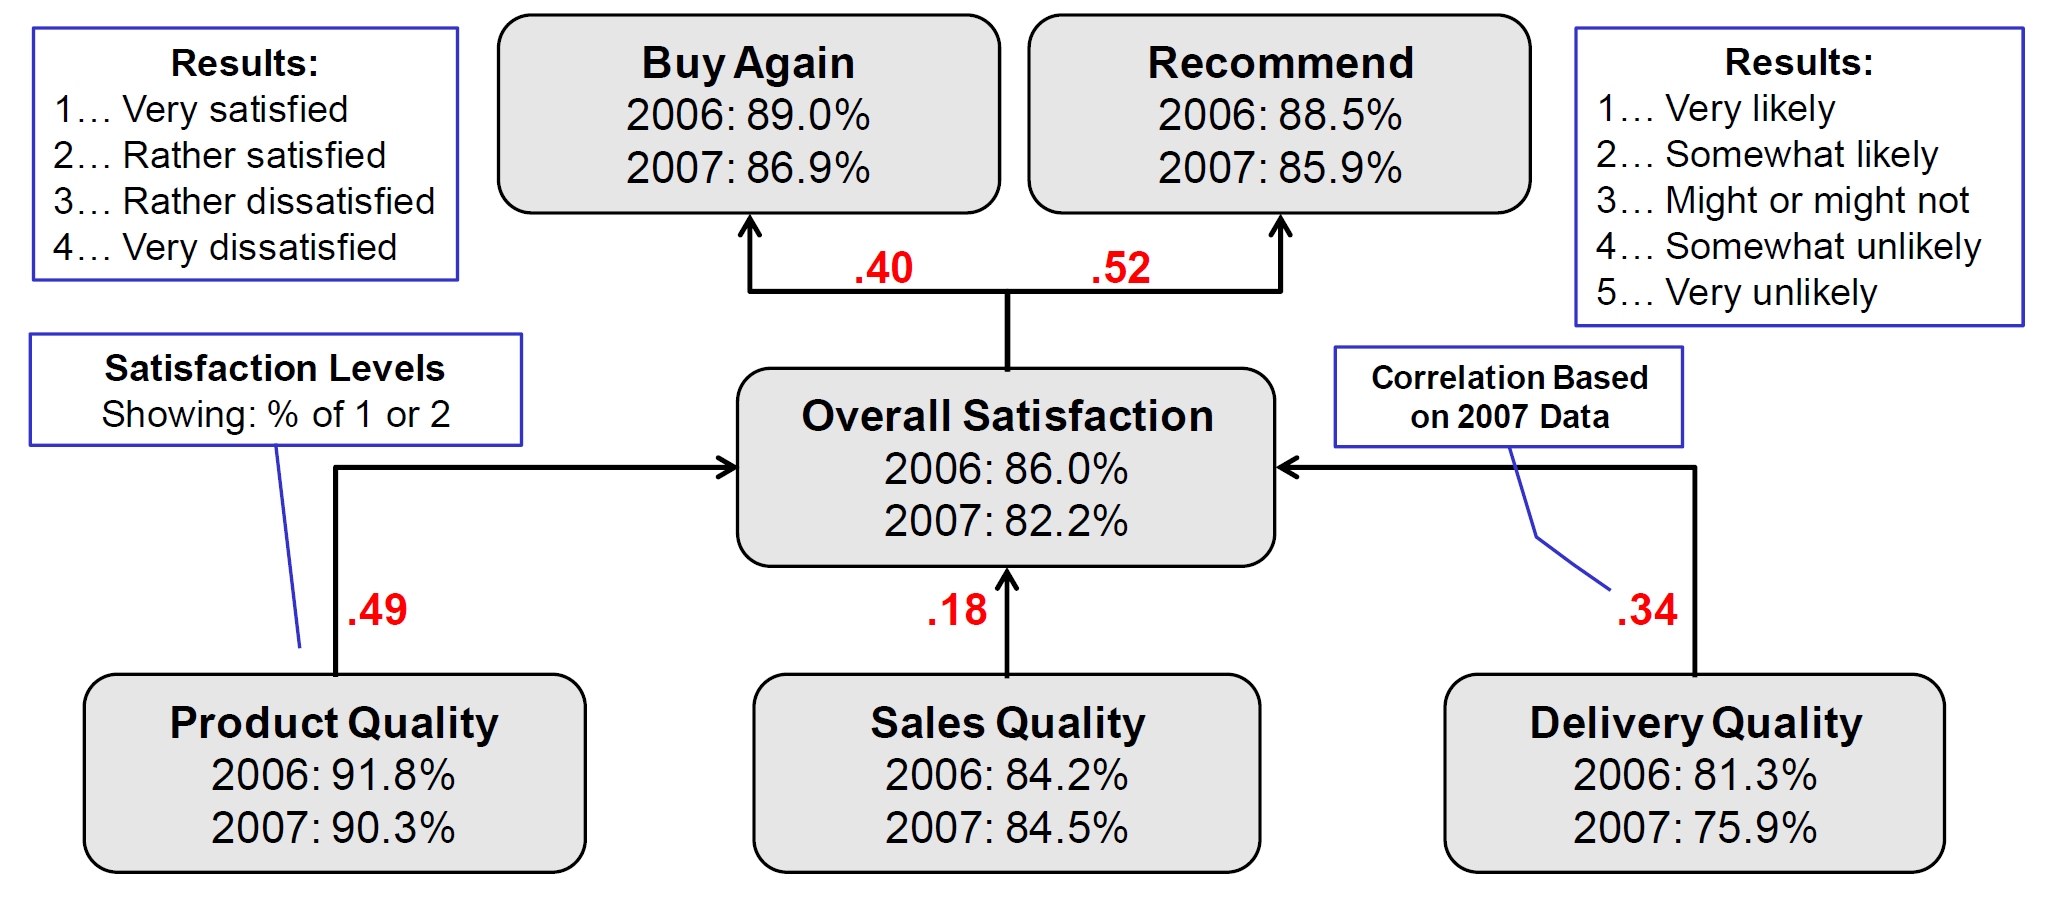
A Home Appliances manufacturing company called upon their staff in the Customer Care Department to analyse new satisfaction data and to suggest actions to the management team. All satisfaction data have been gathered using a four-point Likert scale for satisfaction and “Buy Again” and a five-point Likert scale for “Recommend”, i.e. Net-Promoter-Score.
Some conclusions can be drawn immediately:
Overall satisfaction seems to have dropped from 2006 to 2007.
Tendency to buy again and to recommend have gone down as well.
Product Quality seems to be stable at a high level whereas Sales Quality is lower but stable. Delivery Quality has dropped.
The major driver for satisfaction seems to be Product Quality with Delivery Quality following.
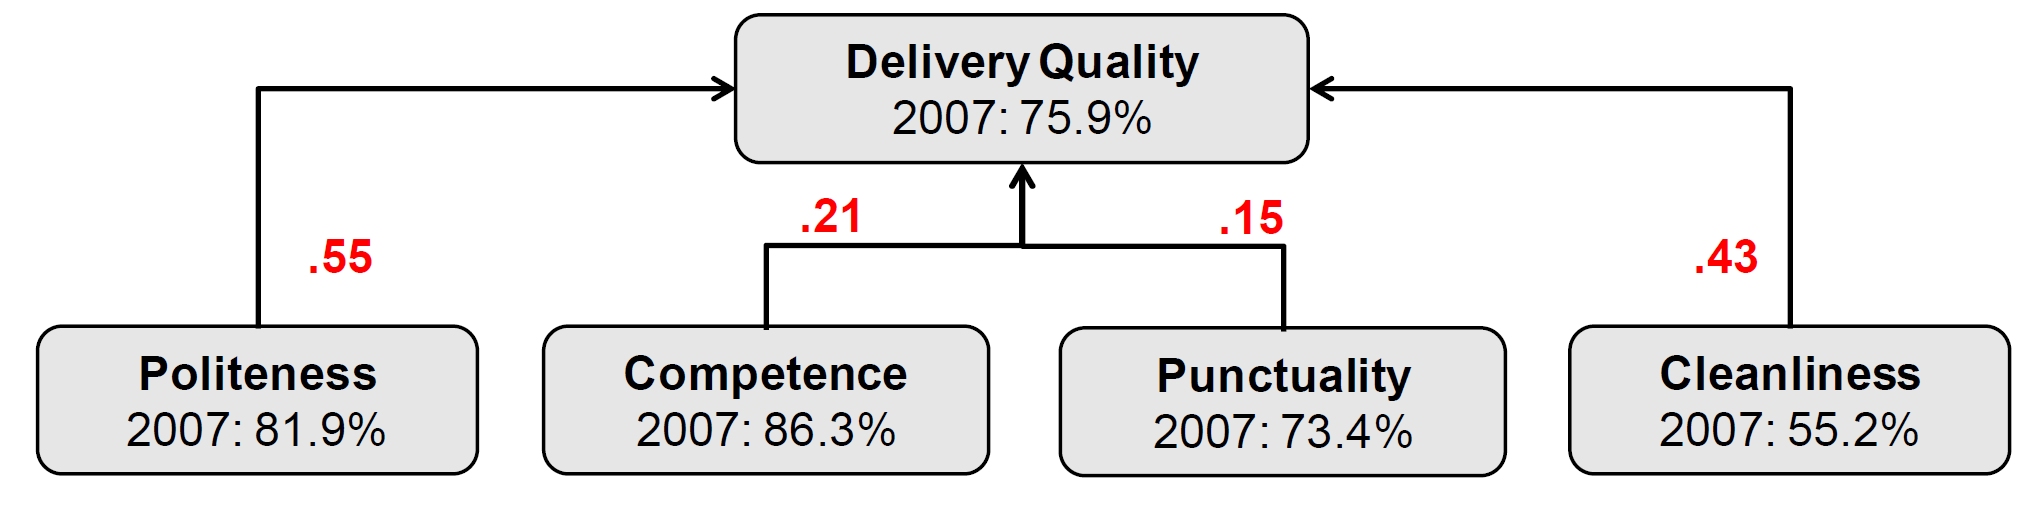
Digging Deeper: Delivery Quality Issues
Calculating confidence intervals for all results has proven significance of all changes, i.e., it makes sense to conduct more detailed analyses to find the culprit for the drop in Delivery Quality.
Looking into the four major drivers for Delivery Quality revealed that Cleanliness and Punctuality leave room for action and have a direct impact (0.43 and 0.55, respectively) on the sentiments on Delivery Quality.
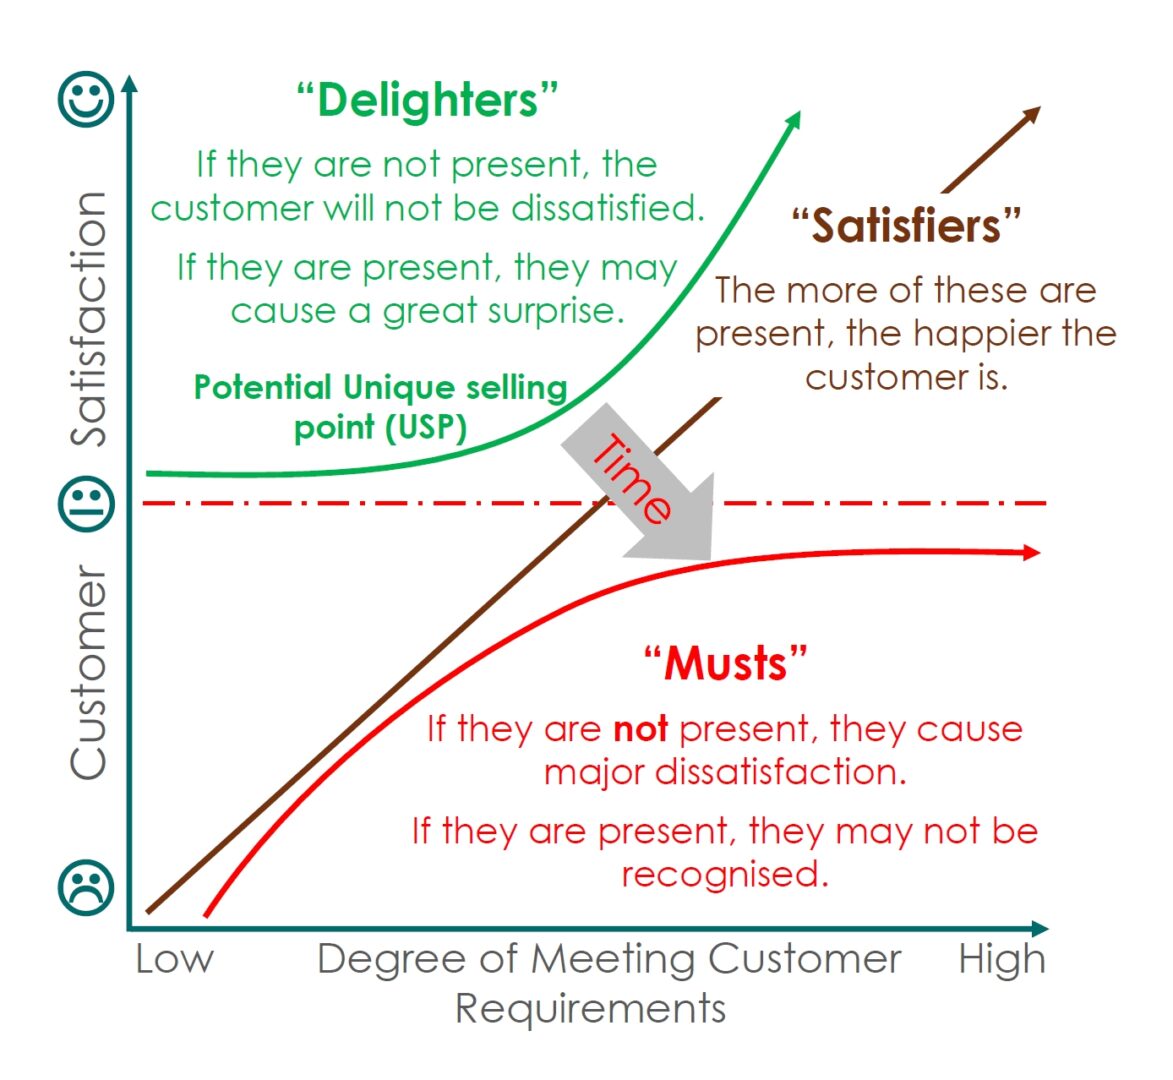
Kano Analysis: Structuring Customer Needs
The Kano Analysis is a tool – often mentioned in Six Sigma trainings, not so often applied in projects – that can greatly help to structure customer needs based on feedback given.
It divides customer needs in four categories:
Musts: This need must be fulfilled. However, fulfilling this need does not result in customer satisfaction, it just avoids dissatisfaction.
Example: Your new car comes with aircon – if you buy it in Singapore.
Satisfiers (The More the Better): Not meeting this need results in dissatisfaction. Delivering on this requirement generates satisfaction – the more the better.
Example: Fuel efficiency of a car is of great interest for most customers.
Prof Noriaki Kano - Alchetron, The Free Social Encyclopedia
Delighter: Characteristic that is not expected by customers; hence does not result in dissatisfaction if not present. However, this characteristic can be used to differentiate in the market, to form a unique selling point.
Example: Receiving your new car with ten years free warranty would be far beyond your expectations.
Indifferent: Customer does not perceive this characteristic as necessary nor does it cause satisfaction if present.
Example: Car manual shows an additional, a foreign language.
When analysing the survey data with the simple Kano model, an additional perspective on customer needs becomes apparent.
Of course, the Musts need to be fulfilled first, Satisfiers (the More the Better) need to be tackled next with the objective to offer at least what the competitors show. Delighters are not obvious, if you could come up with one, it could make all the difference between your products or services and those of competitors.
Conclusion: Turning Data Into Decisions
Customer Satisfaction Data is not easy to come by. Therefore, it is self-explanatory that it should be used to the fullest. Some basic mistakes can be avoided by appointing Green Belts or Black Belts to run analysis of the data. They will know how to run a Kano Analysis or Jaccard Analysis with discrete Likert data.
Survey data should be analysed with different tools at the same time in order to find the most appropriate method to show “patterns in data” that lead to conclusions.
Remember: Survey data are costly to collect – but inexpensive to analyse. The real waste is leaving insights undiscovered.
Next time you review survey results, don’t stop at averages. Apply Kano analysis to distinguish between must-haves, satisfiers, and delighters – and turn expensive data into competitive advantage.
We use cookies to enhance your experience while using our website. If you are using our Services via a browser you can restrict, block or remove cookies through your web browser settings. We also use content and scripts from third parties that may use tracking technologies. You can selectively provide your consent below to allow such third party embeds. For complete information about the cookies we use, data we collect and how we process them, please check our Privacy Policy
Youtube
Consent to display content from - Youtube
Vimeo
Consent to display content from - Vimeo
Google Maps
Consent to display content from - Google
Spotify
Consent to display content from - Spotify
Sound Cloud
Consent to display content from - Sound
We use cookies to enhance your experience while using our website. To learn more about the cookies we use and the data we collect, please check our Privacy Settings.