Great, We Have Improved … or Not?
About Sampling and Confidence Intervals
Many companies spend considerable amounts of money on customer surveys every year. Customer survey results are being used to amend strategies, design new products and services, focus improvement activities and … to celebrate success. Because the impact of customer survey results can be quite hefty, the data driving important decisions shall be trustworthy.
And, the question is: Can we always rely on what we see?
Before being able to show a Personal Career Plan as presented below for Nadia Clark, a member of another organisation, Nadia has been crafting her plan together with her supervisor by completing the following steps:
Do Not Trust the Obvious
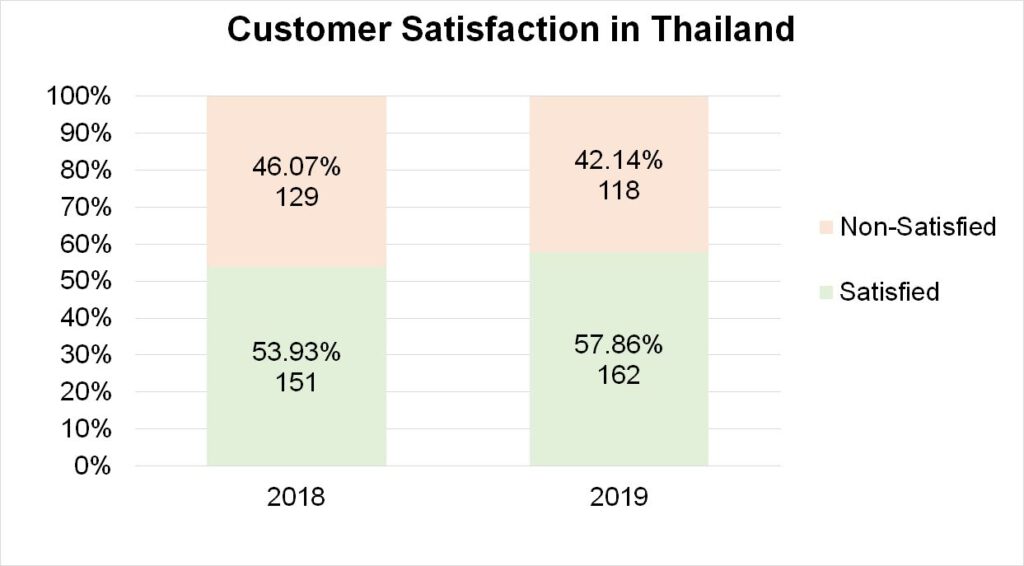
A life insurance company – let us call them MyInsurance – with world-wide market reach was celebrating their success of improving their customers’ satisfaction in 2019. They proudly presented the results: “In Thailand we have achieved 58% satisfied customers as compared to year 2018 when it was only 54%.” This sounds good, right? In a market with millions of consumers, an increase in satisfaction of 4% would mean, the number of customers who would happily buy from MyInsurance again has increased by some ten thousands.
Such kind of conclusion could be too fast. Why? For obvious reasons, MyInsurance did not really ask millions of customers for their opinion. They only managed to gather the opinion from 280 customers. And, this is called sampling. Such approach is in use in every kind of company in every industry many times a day.
Sampling Errors
Sampling is based on a comparatively small number of customers, called “Sample”, and it is the foundation to draw conclusions about the “Population”. Population in this case refers to the entire pool of customers whose opinion we want to gather. Sampling has a huge advantage: it saves money and time and is especially useful when it is nearly impossible to collect data from the whole population or when the process of testing can destroy the object like drop testing of mobile phones. This advantage comes with a disadvantage: the “Margin of Error” or “Confidence Interval”.
Margin of Error – Confidence Interval
Confidence Interval is the range in which we expect the population value to be. Since we do sampling, we can only guess what the “real” value is. In sampling, we never know. This Confidence Interval cannot be avoided, even with a perfectly representative sample under “ideal conditions”. However, this Interval can be reduced by increasing the sample size and by decreasing the variance in the population. The latter is usually not possible. Hence the only choice one has is to determine the minimum sample size for the Confidence Interval one is expecting.
Sampling M&Ms
A very simple experiment will help you understanding what sampling means:
First of all, buy one 200g package of chocolate M&Ms. Then, open your package and count the number of M&Ms in your package. This number – the population – in my case was 233.
First of all, buy one 200g package of chocolate M&Ms. Then, open your package and count the number of M&Ms in your package. This number – the population – in my case was 233.
Sampling means taking a small number of M&Ms out of the population in a representative way. Hence, I took a bowl and filled in my M&Ms. After some shaking and stirring, I turned around and counted a sample of 20 M&Ms out of my bowl – blindly. The first sample gave me no yellow at all. After that, I put my sample back into the population and counted a new sample with 20. Then, second sample revealed 4 yellow M&Ms. Eight more samples gave me 2, 3, 3, 6, 3, 5, 4 and 3 yellow M&Ms, respectively.

Finally, doing the math, my samples suggested that my population has 0%, 20%, 10%, 15%, 15%, 30%, 15%, 25% and 15% yellow, respectively. Which sample is correct?
Now, count the number of yellow M&Ms. In my experiment, this number was 43. It means I have got 18.5% yellow in my population. None of the samples is correct. All of the samples give only an indication for the real percentage of yellow in the population.
Now, count the number of yellow M&Ms. In my experiment, this number was 43. It means I have got 18.5% yellow in my population. None of the samples is correct. All of the samples give only an indication for the real percentage of yellow in the population.
Consequently, we may conclude that sampling results vary even though the population is untouched. Drawing conclusions based on this variation may lead to expensive mistakes.
The Sobering Truth
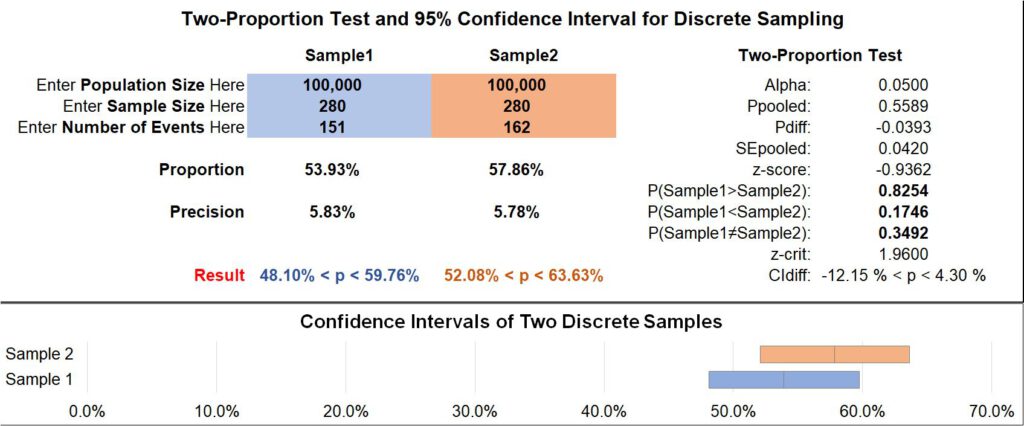
What does this mean in case of MyInsurance? With some simple statistics we can calculate the Confidence Interval for our samples based on the sample size we have got:
In 2018, the “real” customer satisfaction level was between 48% and 60%, as the confidence interval suggests. In 2019, it was between 52% and 64%. So, can we still conclude that we have improved? We cannot!
If MyInsurance wishes to distinguish between a customer satisfaction level of 54% and 58%, they need to have confidence intervals for 54% and 58% that do not overlap. If they would overlap, we could not distinguish between both. Hence, we need confidence intervals of +/- 2% or less for both.
The estimation of the sample size for this requirement tells us that we would need to involve nearly 2,500 customers in our satisfaction survey each year. Again, based on the sample of 280 customers we have taken it can easily be, that there has been no change at all or even worse a decrease in customer satisfaction. We will not know until we have more data to give us a better result.
Unfortunately, in our example MyInsurance has no reason to celebrate success due to increase in customer satisfaction. This assumption could be totally wrong.
Conclusion
Very often important decisions are based on means coming from small samples of data. Sometimes these small samples of data are poorly collected or have a large variation. Unfortunately, we usually do not care a lot about variation in our daily professional or personal life. What matters most is the average, the mean. Because this mean is easy to calculate and everyone understands what it stands for. However, every mean coming out of a sample is only correct for that sample; it is “wrong” for the whole we are trying to make a decision about.
Hence, management would take a great leap in decision making by changing the way they look at data: Don’t trust the yield you have got for your production line, ask for the confidence interval for that. Don’t make an investment decision based on a small sample of data, ask for the minimum improvement this investment will give you.
Don’t trust means, they are lies.
Read more about Data Analytics in typical situations of Organisational Development. Ten cases show nuts and bolts of the analysis steps:
- Formulating a relevant Business Question,
- Acquiring the necessary Data,
- Preparing, i.e. transforming, cleaning the Data,
- Analysing the Data,
- Answering the Business Question.
Analysis is done using easily available tools like MS Excel, MS PowerBI, R. All data is available for download to follow through these analysis steps.

This article is extracted from “Data Analytics for Organisational Development” , which is available in English and German language. More Details.