Every blood donor of a large blood bank has to go through five process steps. These steps are Registration, Screening, HB Test, Donation and Refreshment. At the end of the process, that often takes around an hour, feedback forms are available for the donors. In one week, 210 donors have returned these forms with their satisfaction score for each process step.
This satisfaction score is measured using a six-point scale. The desired rating is either 5 (satisfied) or 6 (very satisfied).
The results are summarised in Figure 1.
From the results obtained, there is an obvious majority of “Not 5 or 6” ratings for Step 5. The question is, is there a significant difference to the other steps’ satisfaction score or are we observing just random variation. How can we test this?
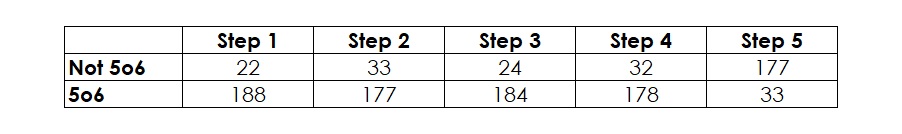
Figure 1: Data for Chi Squared Test
One way is to use the so-called Chi-Squared test (also written Χ2 test, another method is Fisher’s Exact test). The Chi-Squared test is a statistical tool to check whether there is a significant difference between observed frequencies (discrete data) and expected frequencies for two or more groups.
To perform the Chi-Squared test, the following steps are necessary:
1. Plot the Data
For any statistical application, it is essential to combine it with a graphical representation of the data. The selection of tools for this purpose is limited. They include pie chart, column chart and bar chart.
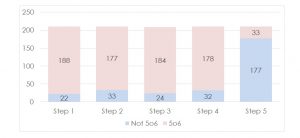
Figure 2: Column Chart for Chi-Squared Test Data
The column chart in Figure 2 reveals, that the customer satisfaction for Step 5 seems drastically lower (more “Not 5 or 6” ratings) compared to the other steps. Although, there does not seem to be any doubt about a worse rating for Step 5, it is a good practice to confirm the finding with a statistical test. Additionally, a statistical test can help to calculate the risk for this decision.
2. Formulate the Hypothesis for ANOVA
In this case, the parameter of interest is an average, i.e. the null-hypothesis is
H0: P1 = P2 = P3 = P4 = P5, with all P being the population proportions of the five process steps in this blood donation process.
This means, the alternative hypothesis is
HA: At least one P is different to at least one other P.
3. Decide on the Acceptable Risk
Since there is no reason for changing the commonly used acceptable risk of 5%, i.e. 0.05, we use this risk as our threshold for making our decision.
4. Select the Right Tool
If there is a need for comparing two or more proportions, the popular test for this situation is the Chi-Squared test.
5. Test the Assumptions
Finally, there is only one prerequisite for the Chi-Squared test to work properly: All expected values need to be at least 5. After the test, we will know whether this assumption holds true.
6. Conduct the Chi-Squared Test
Using the Chi-Squared test, statistics software SigmaXL generates the output in Figure 3.
Since the p-value is 0.0000, i.e. less than 0.05 (or 5 percent), we reject H0 and accept HA. The risk for this decision is zero.
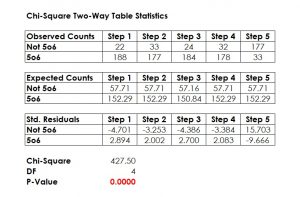
Figure 3: Chi-Squared Test Results
From the test result at Figure 3 we can conclude, that all expected counts are larger than five. This means, the test result is valid.
7. Make a Decision
With this, the Chi-Squared test statistics means that there is at least one significant difference.
In order to interpret the Chi-Squared test results, three steps are necessary:
- Check the p-value. As mentioned earlier, the p-value = 0. This means there is a difference.
- Lock for the highest standardised residual (Std. Residual). The highest standardised residual is 15.703 at step 5. This means, step 5 is significantly different at level “Not 5o6”.
- Check the nature of the deviation. This means, compare Observed Counts and Expected Counts and conclude what the deviation means. In our case, Step 5 is supposed to produce 57.71 “Not 5o6” satisfaction ratings if it was following the average of all steps. Instead, Step 5 delivers 177 of these ratings. Ergo, Step 5 has received statistically worse ratings from the donors.
With this result, it is quite obvious, that interventions are needed to increase the customer satisfaction with Step 5.
Interested in the stats? Read here.