Given today’s need for HR professionals to be strategic business partners, to be a ‘Voice of Conscience’ to the CEO as well as champion for the employees. Those with background in proven management methodologies and tools have a great advantage. HR Professionals who can present their business case for HR strategies and interventions with a compelling return on investment, supported by rock-solid data, will be well respected and regarded.
However, HR data analytics needs to have proper links to the business. Metrics used for the analytics have to be vital to the organisation. Rather than wasting money and time to collect data for the trivial many, the HR data analytics should link to the vital few.
Contributing to HR Data Analytics – Metrics Design
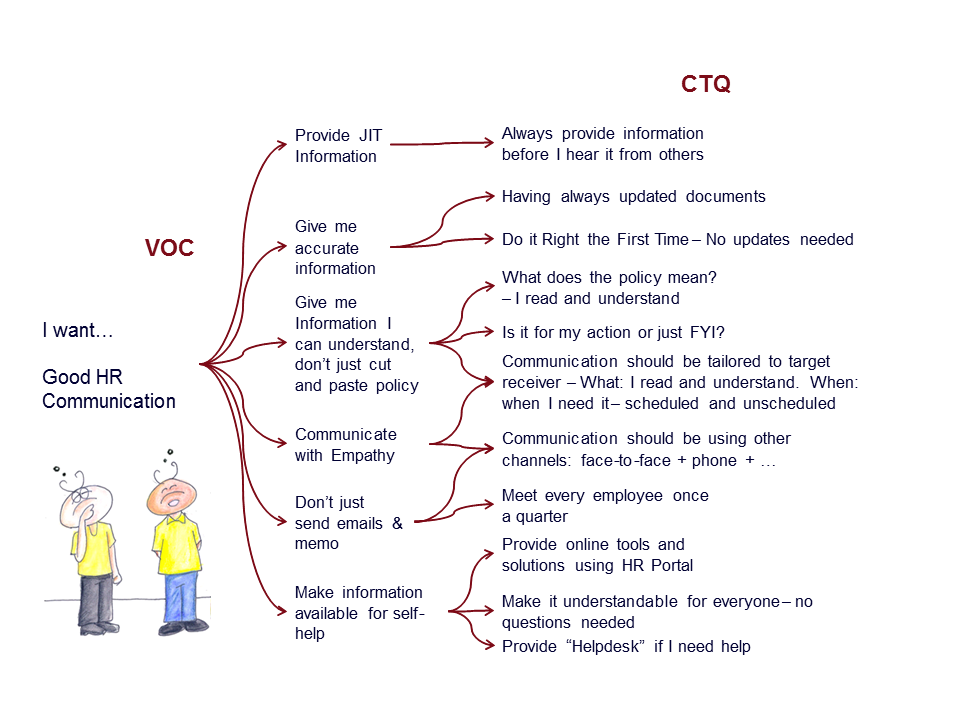
Voice of the Customer (VOC, Figure 1) is a structured multi-step process focusing on capturing the voices of HR’s customers – leaders and staff of your organisation – and translating it into CTQs (Critical to Quality), metrics and actions.
Prioritising Metrics for Data Analytics
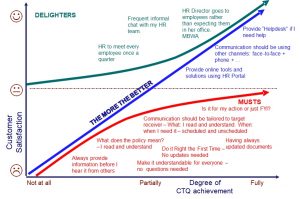
Kano Diagram (Figure 2) is a simple yet powerful tool used to prioritise Customer Needs. Firstly, Musts are expected by your internal customers. By not delivering on Musts, dissatisfaction is inevitable. Hence, there is no need for reinforcements on them. Secondly, The-More-The-Better are satisfiers. More providence on these will contribute to satisfaction. Any form of deficiency will definitely create dissatisfaction. Thirdly, Delighters are representatives of a special set of requirements that can contribute vastly to satisfaction if received and diminutive disappointment if they are not present. They are difficult to detain since the customers usually don’t even think of them due to the minimal expectancy from them.
Understanding the Drivers
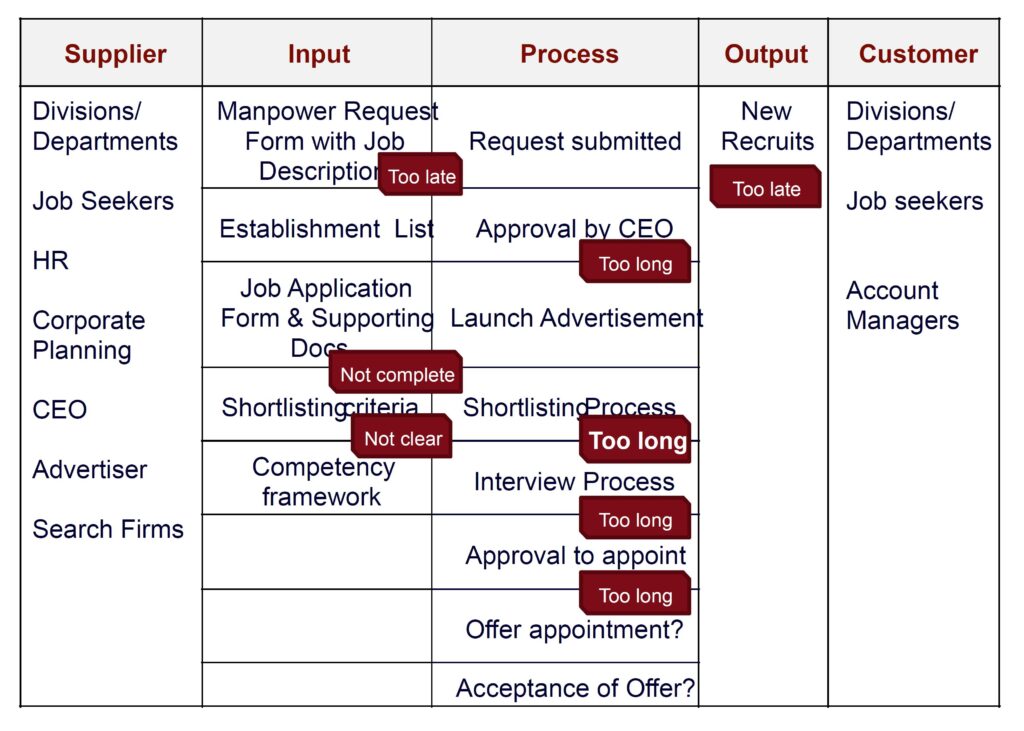
Another tool is Process Mapping (SIPOC, Value-Added Analysis). SIPOC maps Suppliers, Inputs, Process Steps, Outputs and Customers of any given process. This can be a core business process or an HR process. The benefit of a SIPOC is in the high-level understanding of the process and its metrics that drive CTQ metrics. Figure 3 illustrates the effect of a recruitment process. It flags out potential reasons for long turnaround time.
Digging into the details of this process the team found that one of their HR officers performed batching. She kept all the recruitment files until end of the week and tried to complete them on each Friday. If the workload was too much, she kept the remaining of the files until the following Friday…
Such findings are everywhere waiting for you to find. They are easy to embark upon and to resolve once the root cause is clear. However, resolving the issue is only part of the task. The other – sometimes even more important – part of the task is to promote innovative solutions and to encourage cross-departmental learning, managing the change.