The two-sample t-test is one of the most commonly used hypothesis tests in Data Analytics or Lean Six Sigma work. The two-sample t-test offers the statistics for comparing average of two groups and identify whether the groups are really significantly different or if the difference is due instead to random chance.
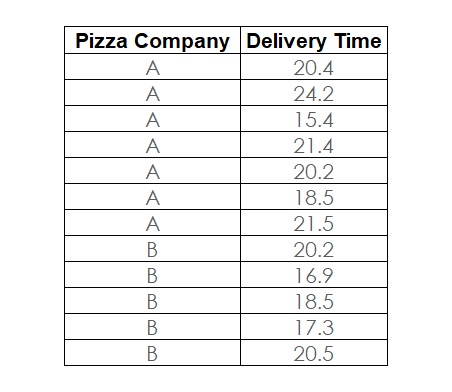
Figure 1: Two-Sample t-Test Data
Most importantly, it helps to answer questions like whether the average success rate is higher after implementing a new sales tool than before or whether the test results of patients who received a drug are better than test results of those who received a placebo.
Here is an example starting with the absolute basics of the two-sample t-test. The question is, whether there is a significant (or only random) difference in the average cycle time to deliver a pizza from Pizza Company A vs. Pizza Company B. Figure 1 shows the data collected from a sample of deliveries of Company A and Company B.
To perform this test, the following steps must be taken:
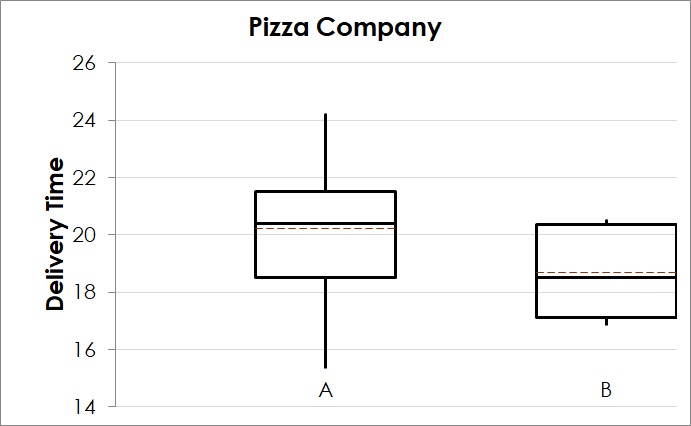
Figure 2: Two-Sample t-Test – Boxplot
1. Plot the Data
For any statistical application, it is essential to combine it with a graphical representation of the data. Several tools are available for this purpose. They include the popular stratified histogram, dotplot or boxplot.
The boxplot in Figure 2 shows that the delivery time for Pizza Company B seems to be lower than for A. However, there is a certain degree of overlap between the two data sets. Therefore, based on this plot, it is risky to draw a conclusion that there is a significant (i.e. statistically proven) difference between the average delivery time of the two companies. A statistical test can help to calculate the risk for this decision.
2. Formulate the Hypothesis for Two-Sample t-Test
In this case, the parameter of interest is an average, i.e. the null-hypothesis is
H0: μA = μB,
with μA and μB being the population means of both companies.
This means, the alternative hypothesis is
HA: μA ≠ μB.
3. Decide on the Acceptable Risk
Since there is no reason for changing the commonly used acceptable risk of 5%, i.e. 0.05, we use this risk as our threshold for making our decision.
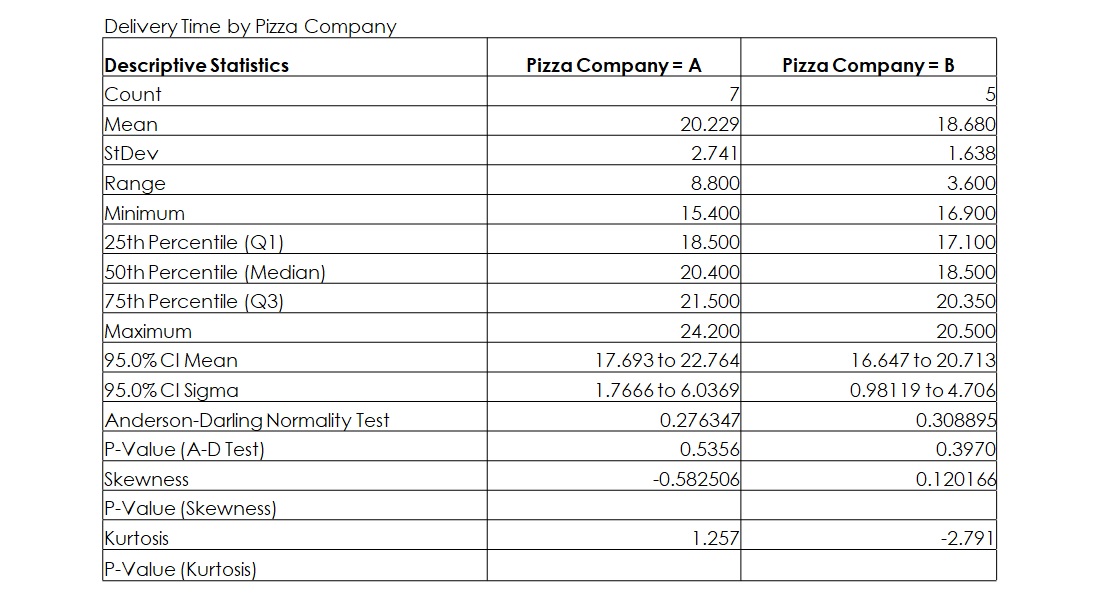
Figure 3: Descriptive Statistics for both Samples
4. Select the Right Tool
If there is a need for comparing two means, the popular test for this situation is the two-sample t-test or Student’s t-test.
5. Test the Assumptions
Finally, the only prerequisite for the application of the two-sample t-test is that data needs to be normal. Therefore, we have drawn the descriptive statistics for both samples (company A and company B).
Since both samples have a p-value above 0.05 (or 5 percent) for the Anderson-Darling Normality test, we can conclude that both samples are normally distributed. The test for normality uses the Anderson Darling test for which the null hypothesis is “Data are normally distributed” and the alternative hypothesis is “Data are not normally distributed.”

Figure 4: Two-sample t-test statistics
6. Conduct the Test
Using the two-sample t-test, statistics software SigmaXL generates the output in Figure 4.
Since the p-value is 0.289, i.e. greater than 0.05 (or 5 percent), we cannot reject H0.
7. Make a Decision
As a result, not rejecting H0 means that there is not enough evidence for assuming a difference. Hence, there is no difference between the means. To say that there is a difference is taking a 28.9% risk of being wrong.
Interested in the stats? Read here.