Linear regression is one of the most commonly used hypothesis tests in Lean Six Sigma work. Linear regression offers the statistics for testing whether two or more sets of continuous data correlate with each other, i.e. whether one drives another one.

Figure 1: Case Data for Linear Regression
Therefore, here is an example starting with the absolute basics of the linear regression. The data stem from a business simulation showcasing package delivery with several parameters being measured. The objective is to find the driver for Delivery Time Y. So, the question is, whether one or more of the potential drivers Coding Time, Packaging Time, Sender and Package Type make a significant difference on the Delivery Time (Figure 1).
To perform linear regression, we follow these steps:
1. Plot the Data
For any statistical application, it is essential to combine it with a graphical representation of the data. Several tools are available for this purpose. If Y (Delivery Time) and X are both continuous (Coding Time and Packaging Time), the scatter plot is the tool of choice. For discrete X (Sender and Package Type) and continuous Y (Delivery Time), a stratified histogram, a dotplot or a boxplot offer help.

Figure 2: Plots for Linear Regression Case
The plots in Figure 2 show all four potential drivers and their potential influence on the delivery time. Obviously, Coding Time drives Delivery Time and Sender and Package Type influence Delivery Time as well. However, there is a problem with this set of plots, the underlying thinking and our preliminary conclusions: Plotting one X against the Y disregards all other variables, i.e. their potential influence is still part of the data set but shows up as random variation. Therefore, obvious questions are:
- Would the obviously marginal influence of Packaging Time on Delivery Time change if the variation by Sender or Packaging Time is accounted for, i.e. eliminated from the model?
- Is it possible that Long Distance packages take longer because the majority of them go to East Coast?
Since it is not possible to show all four Xs and their relationship with the Y in the same plot, we need to refer to statistics for help.
2. Formulate the Hypothesis for Linear Regression
In this case, the parameter of interest is an average, i.e. the null-hypothesis is
H0: X does not influence Y,
with μA and μB being the population means of both companies.
This means, the alternative hypothesis is
HA: X has a significant influence on Y.
3. Decide on the Acceptable Risk
Since there is no reason for changing the commonly used acceptable risk of 5%, i.e. 0.05, we use this risk as our threshold for making our decision.
4. Select the Right Tool
If there is a need for testing the influence of one or more continuous X on a continuous Y, the popular test for this situation is Linear Regression.
5. Test the Assumptions
First of all, there are no requirements on Xs or Y for a regression to be valid. However, the residuals, the data points including the rest variation after application of the regression model, need to follow these requirements:
- Firstly, residuals need to be normally distributed,
- Secondly, residuals need to be independent of time,
- Thirdly, residuals need to be independent of X and
- Finally residuals need to be independent of Fits, i.e. the calculated value for Y after applying the model.
6. Conduct the Test
Using the linear regression, statistics software SigmaXL generates the output in Figure 3.
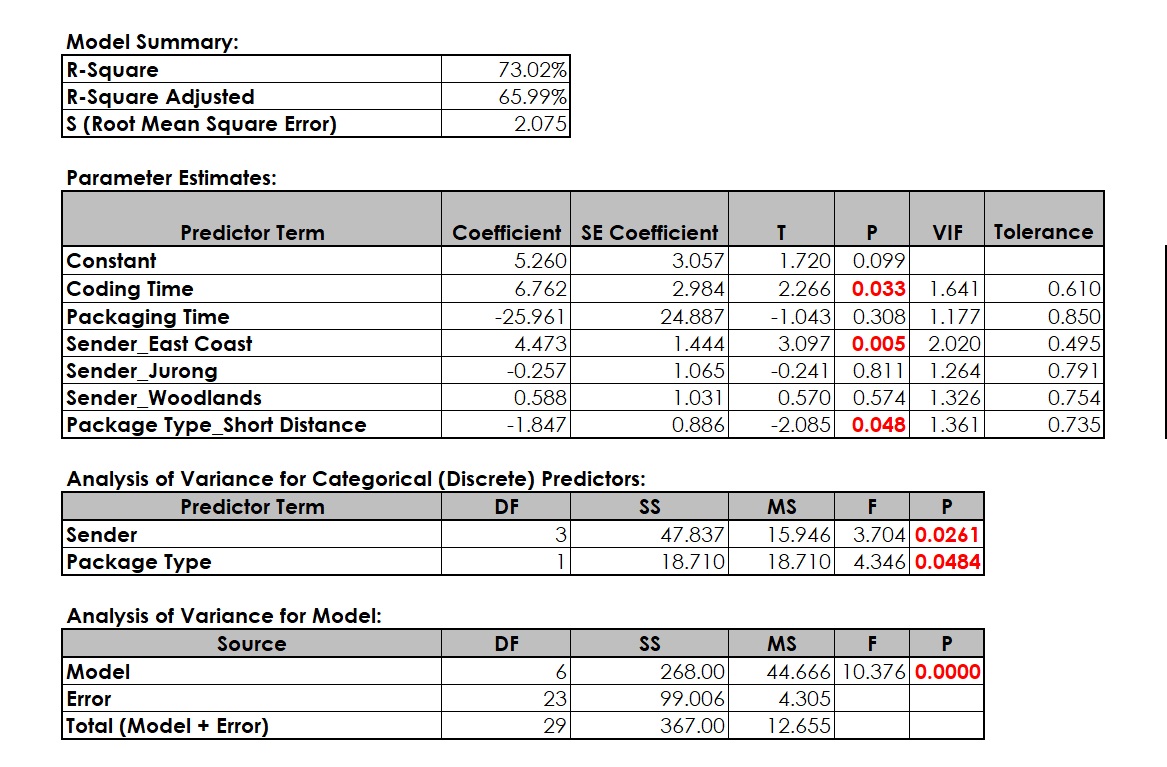
Figure 3: Linear Regression Model – Step 1
The interpretation of linear regression statistics follows certain steps:
- Check of VIF (Variance Inflation Factors). If one or more VIF show a value of 5 or higher, the model is not valid since two or more factors (Xs) correlate with each other. This inter-correlation needs to be removed before proceeding. Solving this issue usually means removing Xs one by one until all VIF are below 5. Try removing factors that you cannot easily measure or control first.
- Check the model p-value. If this p-value is below 0.05 (or 5%), the model is valid, i.e. there is a significant X-Y relationship.
- Check the p-value for all predictor terms. Remove non-significant Xs (predictors, factors) one-by-one and re-run the model after each removal. Start with the highest p-value.
- Check the residuals whether they adhere to the assumptions. This check is especially suitable for finding extreme measurements, i.e. outliers, values that do not seem to fit the model. These values should be investigated regarding accuracy of data collection.
- Formulate the final model.

Figure 4: Linear Regression Model – Step 2
Packaging Time seems to be non-significant, i.e. we have removed this term. Since Sender_Jurong and Sender_Woodlands are part of the Predictor Term Sender, they are automatically part of the model.
7. Make a Decision
As a result, rejecting H0 means that there is a significant relationship between Predictor Terms (Xs) and Delivery Time (Y). In order to influence (reduce) the Delivery Time, we have the option to work on Coding Time, Package Type and Sender. Since Package Type and Sender are customer requirements, it could make sense to change our promised delivery time for different Senders and different Package Types. The regression output delivers a regression equation that helps predicting Delivery Time for different factor settings:
Delivery Time = (2.492) + (7.291) * Coding Time + (4.088) * Sender_East Coast + (-1.900) * Package Type_Short Distance
Interested in the stats? Read here.
Here is the data:
[table id=7 /]
More data:
[table id=8 /]