The two-sample t-test is one of the most commonly used hypothesis tests in Data Analytics or Lean Six Sigma work. The two-sample t-test offers the statistics for comparing average of two groups and identify whether the groups are really significantly different or if the difference is due instead to random chance.
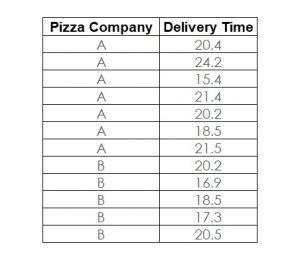
Here is an example starting with the absolute basics of the two-sample t-test. The question is, whether there is a significant (or only random) difference in the average cycle time to deliver a pizza from Pizza Company A vs. Pizza Company B. Figure 1 shows the data collected from a sample of deliveries of Company A and Company B.

1. Plot the Data

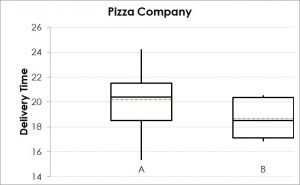
The boxplot in Figure 2 shows that the delivery time for Pizza Company B seems to be lower than for A. However, there is a certain degree of overlap between the two data sets. Therefore, based on this plot, it is risky to draw a conclusion that there is a significant (i.e. statistically proven) difference between the average delivery time of the two companies. A statistical test can help to calculate the risk for this decision.
2. Formulate the Hypothesis for Two-Sample t-Test
3. Decide on the Acceptable Risk
4. Select the Right Tool
If there is a need for comparing two means, the popular test for this situation is the two-sample t-test or Student’s t-test.

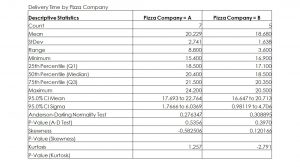
5. Test the Assumptions
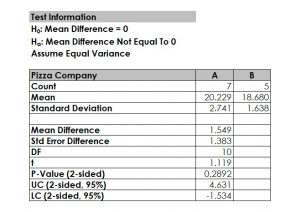
6. Conduct the Test

7. Make a Decision
Interested in the stats? Read here.


