Analytical Storytelling
A Competency for Analysts and Leaders
Today, there is much enthusiasm in organisations about data analytics and data science. It is obvious, that the job of data analysts is not done with the completion of the analysis. Consequently, the job of data scientists and analysts includes translating and communicating an organisational question into a data question and analysis results in organisational language, it includes Analytical Storytelling.

However, the job of a data analyst is not only to collect and validate representative data, clean, transform and analyse that, but also to translate the statistical message in a way that is understandable, compelling and interesting enough for taking it into account when planning strategy and making decisions.
- Who is your Audience? What is their education, their job and hence their appetite for details?
- What is your Intention? Do you wish to inform them only or do you want to trigger action?
- What is the Best Way for Displaying the Information? What is the best chart supporting your intention?
- How can you Simplify your Pitch? How can you translate your information into the language of your audience?
Who is the Audience?
Tailor your Pitch for Them
What is the Purpose of Your Presentation?
Repeat the Key Message

How to Show Data?
Analytical Storytelling Made Interesting
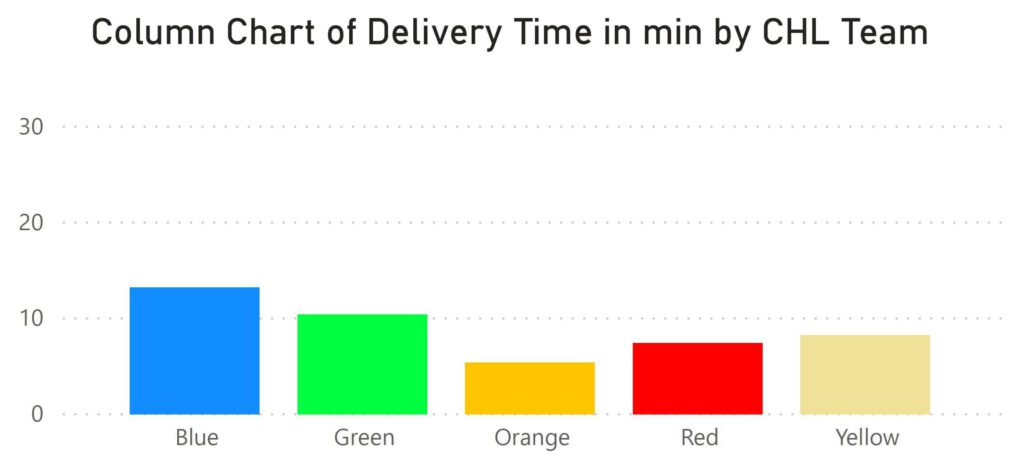
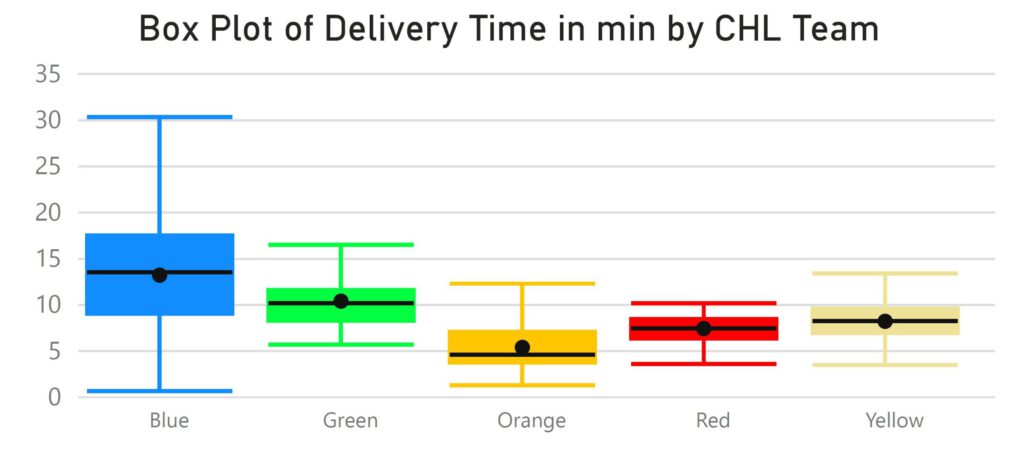
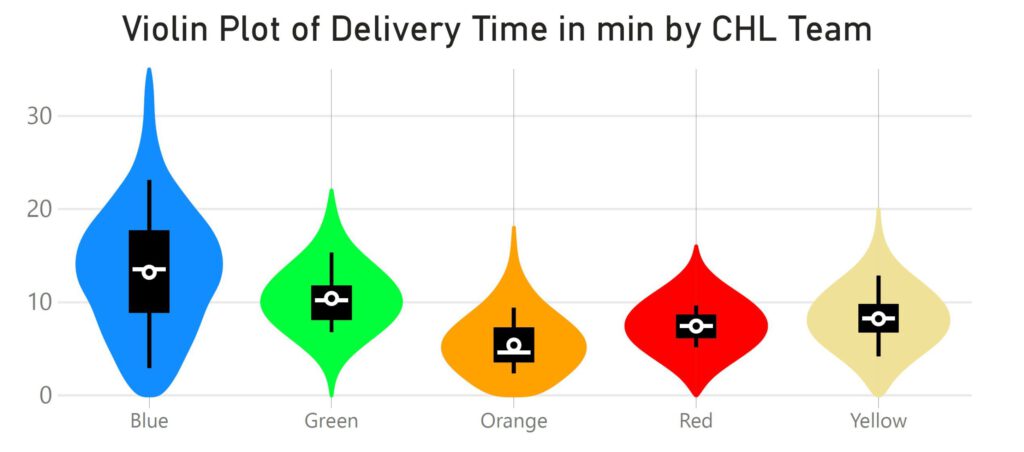
Replace your bar charts with box plots or other alternatives, if possible.
Your audience will highly appreciate it.
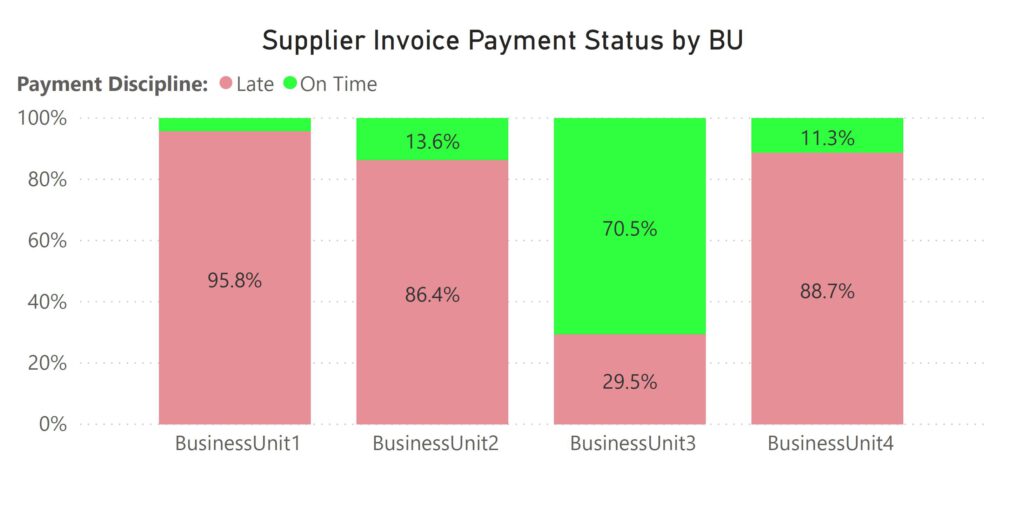
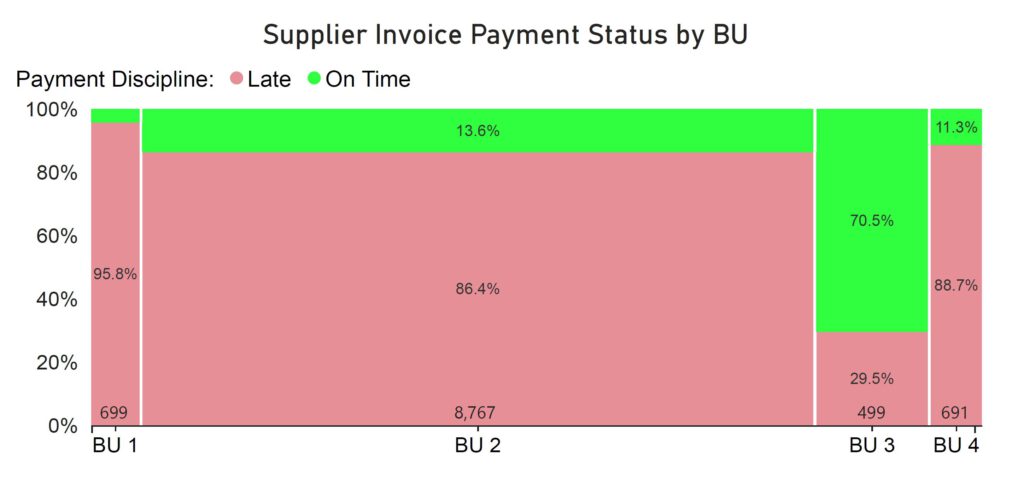
However, the following Marimekko chart (mosaic plot) illustrates the number of invoices received by each unit. It shows that BU 2 has many more suppliers waiting to get paid than all other units together. BU 2 is the real problem.
How to Simplify the Presentation?
Analytical Storytelling for Non-Analysts

Column Chart – Marimekko Chart

Conclusion
- Formulating a relevant Business Question,
- Acquiring the necessary Data,
- Preparing, i.e. transforming, cleaning the Data,
- Analysing the Data,
- Answering the Business Question.