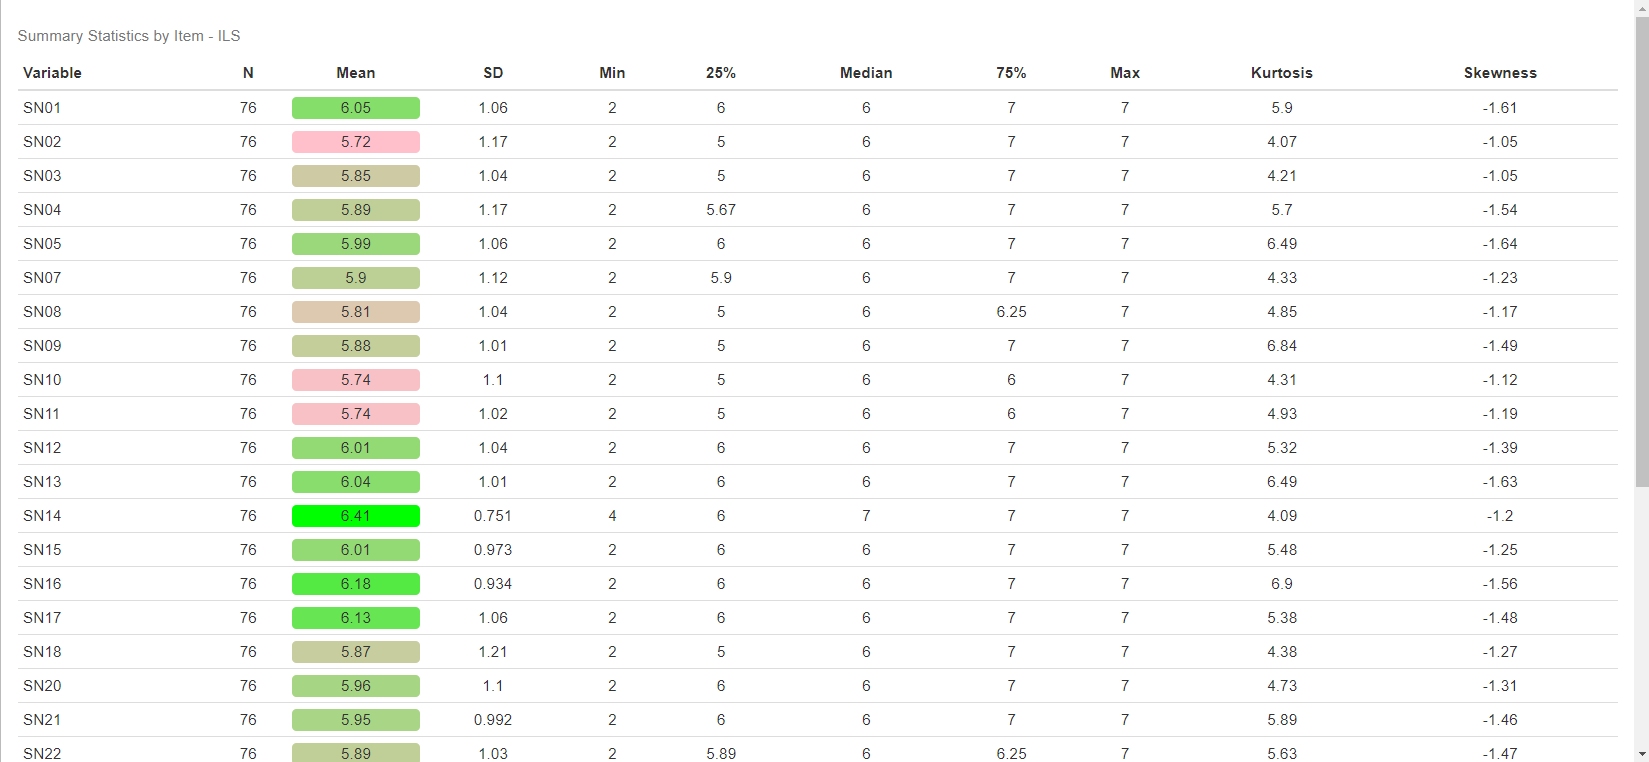
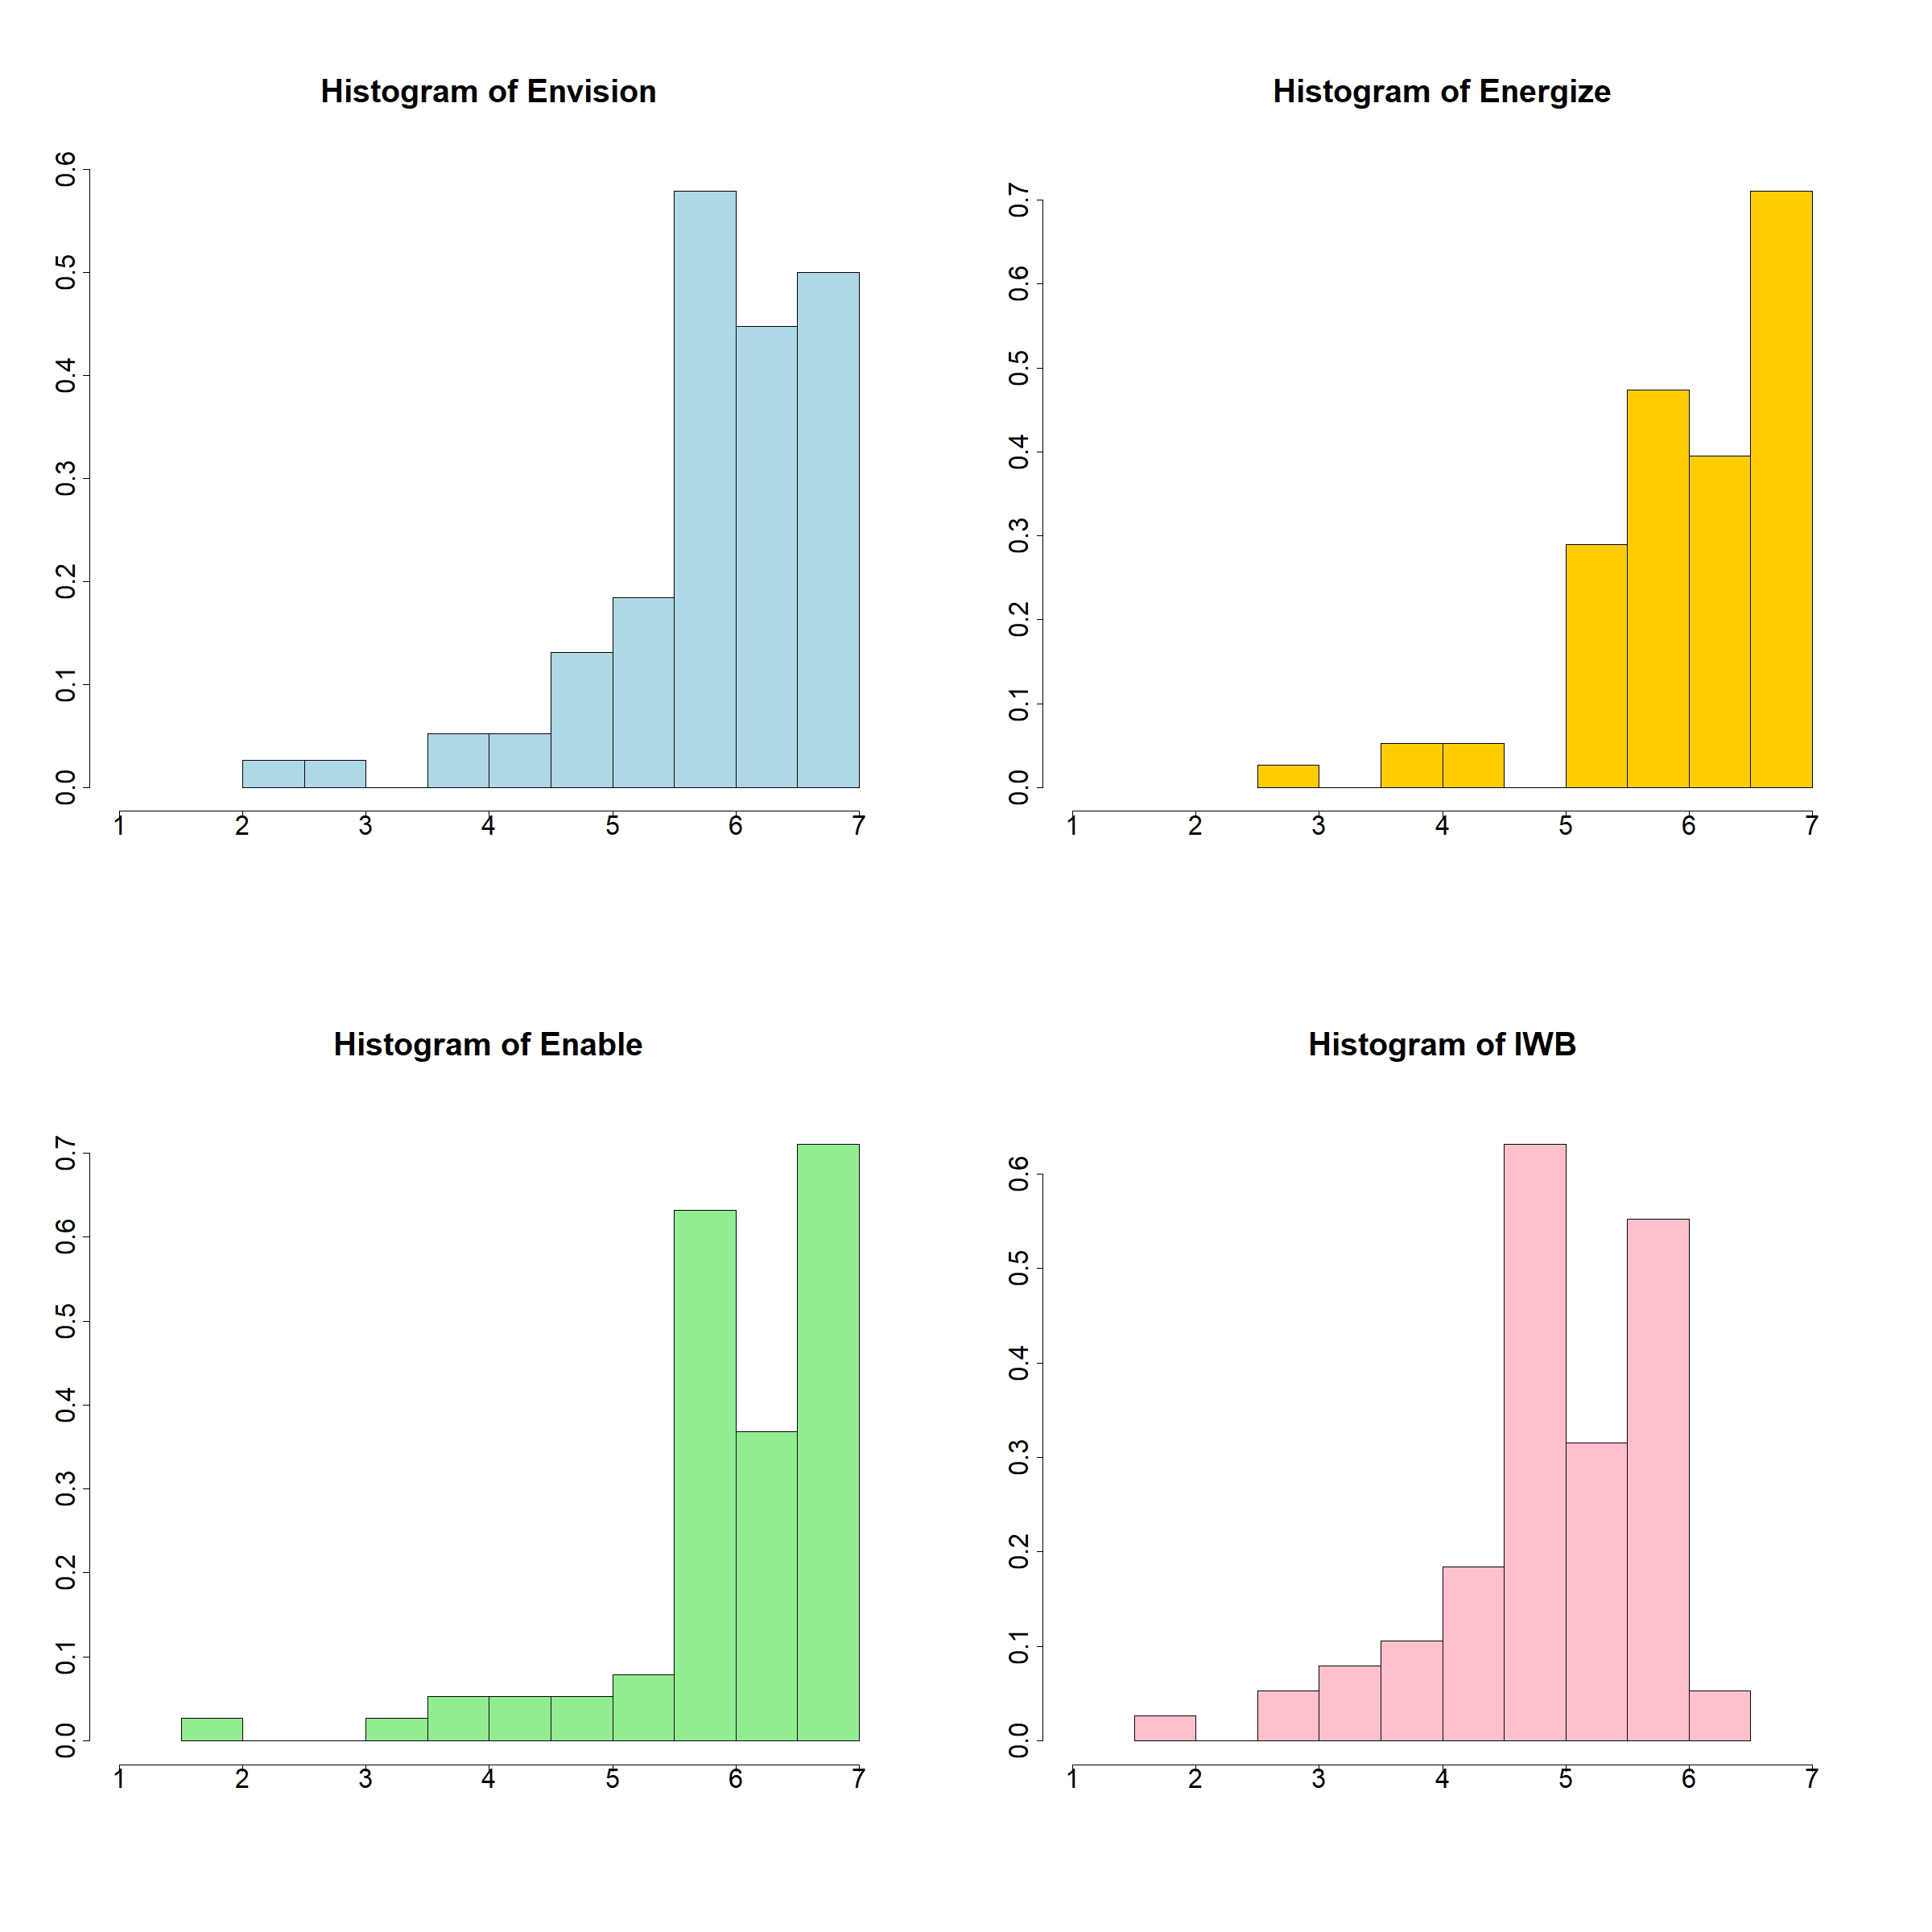
Every statistical analysis must be accompanied with the appropriate graphs. Whilst graphs do not drive decisions, they always add information not available in descriptive statistics of any kind.
Knowing the distribution of the data, for example, guides the researcher’s choice of tools for the next steps towards the Innovation Leader Survey.