Get a Quote

Predictive Modelling Using R

Predictive Modelling Using R

Welcome to our comprehensive guide on predictive modelling! This webpage is dedicated to providing an in-depth exploration of various modelling techniques utilised in both supervised and unsupervised machine learning. Here, you’ll find meticulously crafted code and output examples designed to showcase the power and versatility of these techniques.

Whether you’re a seasoned data scientist or just beginning your journey into the world of machine learning, our resources are tailored to enhance your understanding and practical skills. Dive in and discover how predictive modelling can transform data into actionable insights, driving innovation and informed decision-making in your field.

Data Preparation

This foundational step involves cleaning and transforming raw data to ensure accuracy and consistency, which is crucial for reliable model outcomes. Techniques include handling missing data, dealing with outliers, and creating appropriate visualisations like histograms and scatter plots.

Data preparation includes

  • Dealing with Missing Data
  • Dealing with Outliers
  • Creating Histogram and Scatter Plot
  • Performing Descriptive Statistics
  • Performing Transformations
  • Plotting side-by-side histograms
  • Understanding Skewness + Kurtosis
  • Conducting transformations to reach Normality
  • Plotting Histogram with Normal Distribution
  • Plotting Normal Q-Q Plot
  • Creating indicator Variables
  • Finding Duplicated Records

R Chunks for Data Preparation.

Predictive Modelling

Simple Linear Regression

A supervised Machine Learning Technique

This method models the relationship between a single independent variable and a dependent variable by fitting a linear equation. It’s useful for understanding and predicting outcomes based on one predictor, and includes assessing the strength of the relationship through correlation coefficients.

Simple Linear Regression includes

  • Calculating Pearson’s Correlation Coefficient
  • Plotting Scatter Plot
  • Plotting Scatter Plot with Regression Line
  • Identifying High-Leverage Points
  • Identifying Influential Observations
  • Checking Normality of Residuals
  • Checking Other Requirements on Residuals
  • Calculating Predictions
  • Plotting and Calculating Confidence and Prediction Interval
  • Dealing with Categories in Regression
  • Identifying Importance of Predictors
  • Plotting Importance Chart for Regression Predictors

R Chunks for Simple Linear Regression.

Predictive Modelling

Multiple Linear Regression

A supervised Machine Learning Technique

Lorem Ipsum is simply dummy text of the printing and typesetting industry. Lorem Ipsum has been the industrys standard dummy text ever since the 1500s, when an unknown printer took a galley of type and scrambled it to make a type specimen book.

Multiple Linear Regression includes

  • Computing Correlation Matrix
  • Showing Correlation Matrix
  • Running Regression
  • Displaying 3-D Plot
  • Calculating Prediction with Confidence and Prediction Interval
  • Showing High Leverage Points and Influential Observations
  • Making Indicator Variables for Shelf and Running Regression
  • Exploring Multicollinearity
  • Checking Whether Residuals Are Normal
  • Plotting All Residual Plots
  • Plotting All Residual Plots against Xs
  • Testing Model
  • Preparing Data for Pie Chart to Show Relative Importance of Factors
  • Showing Pie Chart of Sum of Squares for Regression Model

R Chunks for Multiple Linear Regression.

Predictive Modelling

Logistic Regression

A supervised Machine Learning Technique

Used when the dependent variable is categorical, logistic regression estimates the probability of an event occurring. It’s particularly valuable for classification problems, such as determining whether a customer will churn or not, based on predictor variables.

Logistic Regression includes

  • Linear and Logistic Regression for Disease Data
  • Logistic Regression with TelcoChurn Data
  • Logistic Regression with Space Shuttle Data.

The following steps are performed on each dataset:

  • Exploring data
  • Plotting Data as Scatter Plot
  • Plotting Regression Line with 95% CI
  • Calculating McFadden’s Rsquared
  • Calculating Confidence and Prediction Interval for given X data
  • Calculating Odds Ratio
  • Calculating Deviance

R Chunks for Logistic Regression.

Predictive Modelling

Classification and Decision Trees

A supervised Machine Learning Technique

Decision trees are intuitive models that split the data into branches based on feature values, leading to easily interpretable classifications or predictions. They are particularly useful for handling both numerical and categorical variables, and they can capture non-linear relationships effectively.

Classification and Regression Trees includes

  • Classification and Regression Tree Using CART
  • Classification and Regression Tree Using Conditional Inference Tree (CTREE, C4.5 Method)
  • Classification and Regression Tree Using Conditional Inference Tree (C5.0, C5.0 Method)
  • Plot Decision Tree Using Partykit
  • Classification Using Random Forest

R Chunks for Classification and Regression Trees.

Artificial Neural Networks

A supervised Machine Learning Technique

Artificial Neural Networks (ANN) are powerful models inspired by the human brain, capable of capturing complex, non-linear relationships in data. They are particularly effective for tasks like image recognition, natural language processing, and predictive modelling with large datasets. However, they require significant computational power and careful tuning of hyperparameters to achieve optimal performance.

Artificial Neural Networks include

  • Fitting Neural Network for Cereals Data
  • Predicting Using Neural Network for Cereals Data
  • Fitting ANN for Adults Data (3 hidden nodes)
  • Predicting Using Neural Network for Adults Data
  • Running the Prediction for Adults Data (3 hidden nodes)
  • Generating Confusion Matrix and Statistics for ANN on Adults Data

R Chunks for Artificial Neural Networks.

Predictive Modelling

Model Evaluation Methods

Applied to supervised Machine Learning Techniques

Evaluating predictive models is a critical step to ensure their accuracy, reliability, and applicability to real-world scenarios.

For multiple regression models, evaluation focuses on assessing goodness-of-fit measures like R-squared and residual analysis.

Classification and Regression Trees (CART) are evaluated using metrics such as accuracy, precision, recall, and cross-validation techniques.

Comparing the performance of models, such as linear regression or logistic regression versus CART, highlights their strengths and limitations in predicting outcomes and helps select the most suitable approach for specific tasks.

Model Evaluation Methods include

  • Model Evaluation Techniques for Multiple Regression
  • Model Evaluation Techniques for Classification and Regression Trees Using Adult Income Data
  • Model Evaluation Techniques for Classification and Regression Trees Using Wine Data
  • Comparing Prediction Performance of Linear Model and CART Model

R Chunks for Model Evaluation Techniques.

Predictive Modelling

Clustering

An unsupervised Machine Learning Technique

Clustering is an unsupervised machine learning technique used to group similar data points based on their characteristics.

It helps identify patterns and structures within data without predefined labels, making it useful in fields like customer segmentation, anomaly detection, and image recognition.

Common clustering algorithms include K-Means, Hierarchical Clustering, and DBSCAN, each suited for different data distributions.

The goal is to maximize intra-cluster similarity while minimizing inter-cluster similarity.

Effective clustering can reveal hidden insights, aiding decision-making and predictive modeling.

Clustering Methods include

  • Estimating the Optimal Number of k-Means Clusters
  • Visualise Clusters
  • Compute Cluster Indicators
  • Compute Cluster Details
  • Plot Cluster Silhouette
  • Check Validity with R-square and Pseudo-F
  •  

R Chunks for Clustering.

Predictive Modelling

Association Rules

An unsupervised Machine Learning Technique

Association rule mining is a data mining technique used to uncover relationships between variables in large datasets.

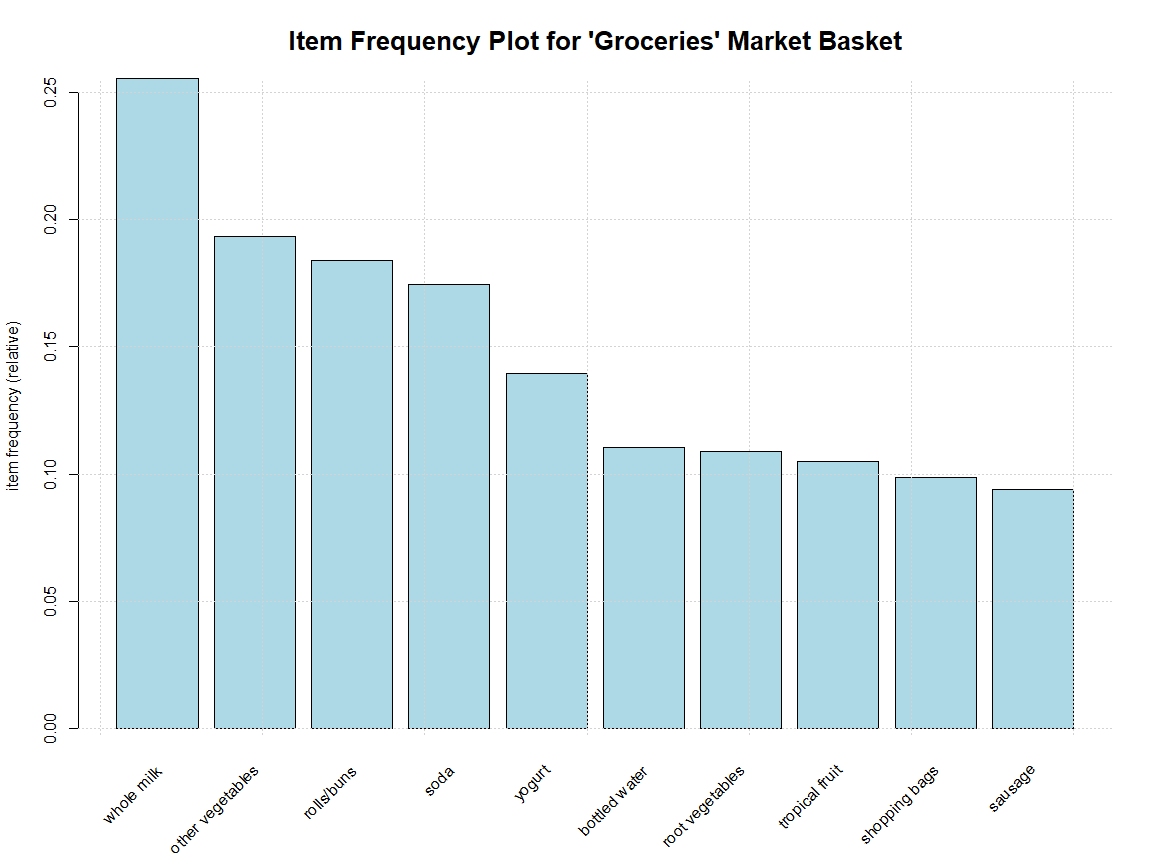
It is commonly applied in market basket analysis to identify product purchase patterns, such as “customers who buy bread often buy butter.”

The most well-known algorithm for generating association rules is the Apriori algorithm, which uses support, confidence, and lift measures to determine rule significance.

This technique helps businesses optimise marketing strategies, improve recommendations, and enhance inventory management.

By discovering meaningful associations, organisations can gain valuable insights into consumer behaviour and data dependencies.

Association Rules include

  • Mining Association Rules with Certain Confidence
  • Defining Association Details for Specific Rule
  • Visualising Rules
  • Showing Association indicators like Support, Confidence, Lift
  • Evaluating Association Models

R Chunks for Association Rules.

Predictive Modelling
Privacy Settings
We use cookies to enhance your experience while using our website. If you are using our Services via a browser you can restrict, block or remove cookies through your web browser settings. We also use content and scripts from third parties that may use tracking technologies. You can selectively provide your consent below to allow such third party embeds. For complete information about the cookies we use, data we collect and how we process them, please check our Privacy Policy
Youtube
Consent to display content from - Youtube
Vimeo
Consent to display content from - Vimeo
Google Maps
Consent to display content from - Google
Spotify
Consent to display content from - Spotify
Sound Cloud
Consent to display content from - Sound