Get a Quote

Lean Six Sigma ANALYSE Phase

Lean Six Sigma ANALYSE Phase

In the Lean Six Sigma ANALYSE phase, the in MEASURE selected potential root causes are examined concerning their influence on the problem using the previously collected data.

The Lean Six Sigma ANALYSE phase describes two different analysis approaches. One approach uses tools for data analysis – data analytics, whereas the other approach features tools for process analysis. Usually, both approaches are necessary to perform comprehensive root cause analysis. However, experience has shown that turn-around-time problems are predisposed to be studied using process analysis tools, while defect analysis is better performed using data analysis tools. The respective other approach supports the principle toolset.

The principal task of the Lean Six Sigma ANALYSE phase is the identification of vital few root causes.

The following list of tasks may not be needed for all Lean Six Sigma projects, on the one hand. On the other hand, some projects may even require additional tasks to be completed. The list of tasks required depends on the problem that needs to be solved and the data that needs to be handled.

1. Process Analysis

The objective of this step is to use process analysis methods to identify the causes which are critical for the problem, and to evaluate their influence on the process result.

To get an overview over a process, the SIPOC suggested in an earlier chapter is used. Therefore, we won’t present this tool again here.

After the critical steps are shown in the overall process flow with the help of the SIPOC, it is usually necessary to prepare a more detailed map of the entire process by using a flow diagram or flow chart. There are different flow charts to use depending on the problem to identify: Deployment Flow Chart, Value Stream Map, Spaghetti Flow Chart and others.

Deployment Flowchart

Deployment flowcharts show the process flow with the peculiarity that activities are represented by the affected locations or functions in so-called swim lanes. This results in an overview over interfaces, which, in processes, often form root causes for problems, at least for delays.

Whenever there is a hand-over from one function to another one, the arrow crosses a swim lane. This highlight potential issues.

Lean Six Sigma Phase Analyse

Value Stream Map

The efficiency of a process can be expressed as the ratio of the time for value-adding activities to the total time required for a process. A value-adding process step is present if all of the following requirements are met:

  1. Customers are ready to pay for the corresponding process step, since an additional value is created for them.
  2. The corresponding process step results in a physical change to the product or service.
  3. The process step is done successfully the first time.

With these criteria, all process steps are reviewed, and checked for value-creation. This can be done directly in any flowchart. Alternatively, a value stream map can be created.

Lean Six Sigma Phase Analyse

The value stream map shows only three steps that add value to the customer: Collect Package, Packaging, Deliver Package.

This value stream map includes a takt time of 19 seconds that is derived out of available time (19 minutes) divided by demand (60 packages). Process bottlenecks can be identified by comparing processing time (P/T) for each step with the takt time. Two process steps turn out to be bottlenecks, “Identify Sender and Receiver” and “Compute Weight and Insurance Fee”. These steps cannot be performed without process redesign or additional staff.

Spaghetti Diagram

Spaghetti diagrams are used when the causes for long processing time are to be sought in spatial conditions and in the resulting transportation paths. With these diagrams, it becomes clear which paths require long processing times, and therefore have a potential for improvement. They graphically show the waste in the categories transportation and movement.

This step provides the following results:

  • Representation of the order of events of the process,
  • Process indicators, such as efficiency and takt time,
  • Indications about waste in the process and
  • Indications about bottlenecks in the process.
Lean Six Sigma Phase Analyse

2. Data Analysis

The goal of this step is to use data analysis methods to identify the critical causes for the problem, and to evaluate its influence on the process result. Data analysis methods are also known as data analytics.

Graphical Analysis

For the graphical analysis of the influence of a discrete variable with on a continuous result variable, several tools are available, which allow stratification of the data. These tools are stratified histogram, dotplot, and boxplot.

For the graphical analysis of continuous influence variables on continuous result variables, the so-called scatter plots  are used.

For the representation of the discrete result variable Y for discrete influence variables X, pie charts and bar graphs can be used.

For the representation of a discrete result variable Y with a continuous influence variable X, the graphs dotplot and boxplot, seen in Task 1, can be used as well. However, for this purpose, X and Y are swapped in the graph.

Statistical Analysis

For the statistical analysis of the influence of a discrete variable on a continuous result variable, several tools are available. These tools include t-test for normal-distributed data, Mann-Whitney-Test for non-normal distributed data, ANOVA for normal-distributed data, Kruskal-Wallis Test for non-normal distributed data.

For the statistical analysis of the influence of a continuous variable on a continuous result variable, several tools are available. These tools include correlation analysis, regression analysis.

For the statistical analysis of the influence of a discrete variable on a discrete result variable, several tools are available. These tools include 2-proportion test, Chi-Squared test.

For the statistical analysis of the influence of a continuous variable on a discrete result variable, several tools are available. These tools include logistic regression.

This step provides the following results:

  • Statements about the influence of the potential causes and stratification factors X on the result variable Y and
  • Quantification of the influence of the potential causes and stratification factors X on the result variable Y.

3. Driver Analysis

In service processes, searching for causes for process problems, based on human influence, is often more complex than in technical processes, where after determining a significant process parameter, the settings can be changed correspondingly, and the process result often reacts immediately to such a change.

After identifying a critical cause for a problem in a service process, the background for it is investigated, so as to be able to develop improvement measures that will be successful and have a long-term effect.

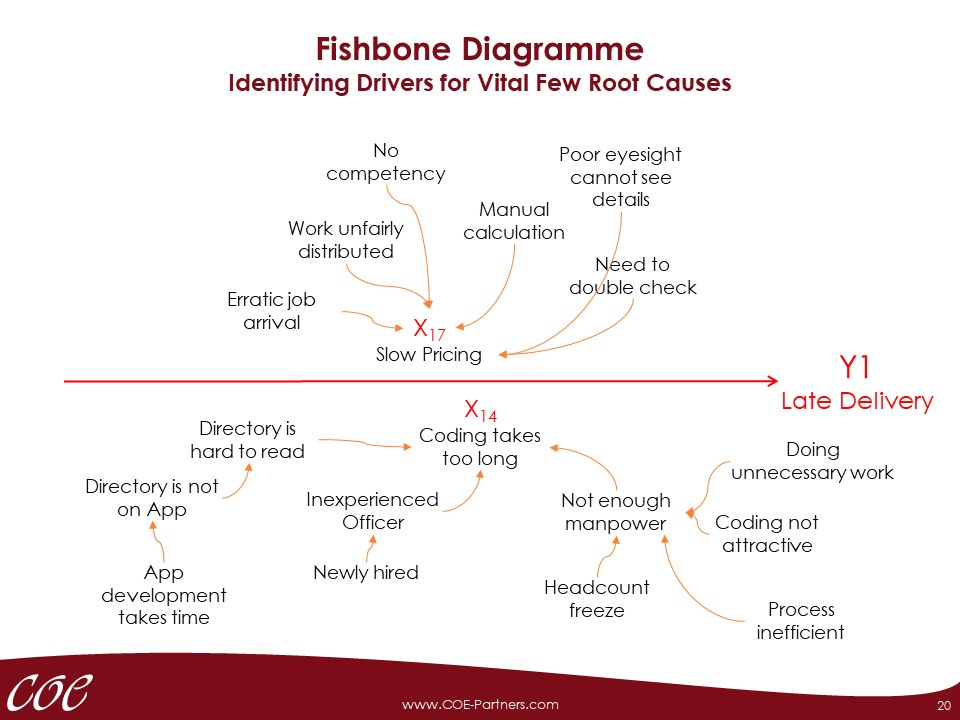
The goal of this step is to determine the drivers for the critical root causes that have already been identified.

This task can be done using the fishbone diagram by identifying drivers for the as significant determined Xs.

Lean Six Sigma Phase Analyse

This step provides the following results:

  • Drivers for critical causes.

Conclusion – Lean Six Sigma ANALYSE Phase

After the Lean Six Sigma ANALYSE phase has been completed by undergoing the above mentioned tasks, the Lean Six Sigma phase IMPROVE can be started.

This Lean Six Sigma ANALYSE phase has the following deliverables:

  • A list of confirmed vital few root causes of the problem and
  • Evidence for the degree of influence of these root causes on the problem.

Proceed to IMPROVE.

Privacy Settings
We use cookies to enhance your experience while using our website. If you are using our Services via a browser you can restrict, block or remove cookies through your web browser settings. We also use content and scripts from third parties that may use tracking technologies. You can selectively provide your consent below to allow such third party embeds. For complete information about the cookies we use, data we collect and how we process them, please check our Privacy Policy
Youtube
Consent to display content from - Youtube
Vimeo
Consent to display content from - Vimeo
Google Maps
Consent to display content from - Google
Spotify
Consent to display content from - Spotify
Sound Cloud
Consent to display content from - Sound