
- +65 61000 263
- Contact@COE-Partners.com
- Newsletter
Data Analytics becomes more and more important for any organisation over all industries worldwide. This trend has to do with two developments: Firstly, more and more high-quality data is available to describe any kind of business-related activities, consumer behaviour and workforce matters. Secondly, potent hard- and software is at hand that can handle, analyse and save huge amounts of data.
One of the popular analysis packages is R. Data analytics with R and R Studio is an easy way to overcome high costs for powerful analysis tools. In the following, we offer some examples of data analytics with R.
Data Analytics with R: Code and Results
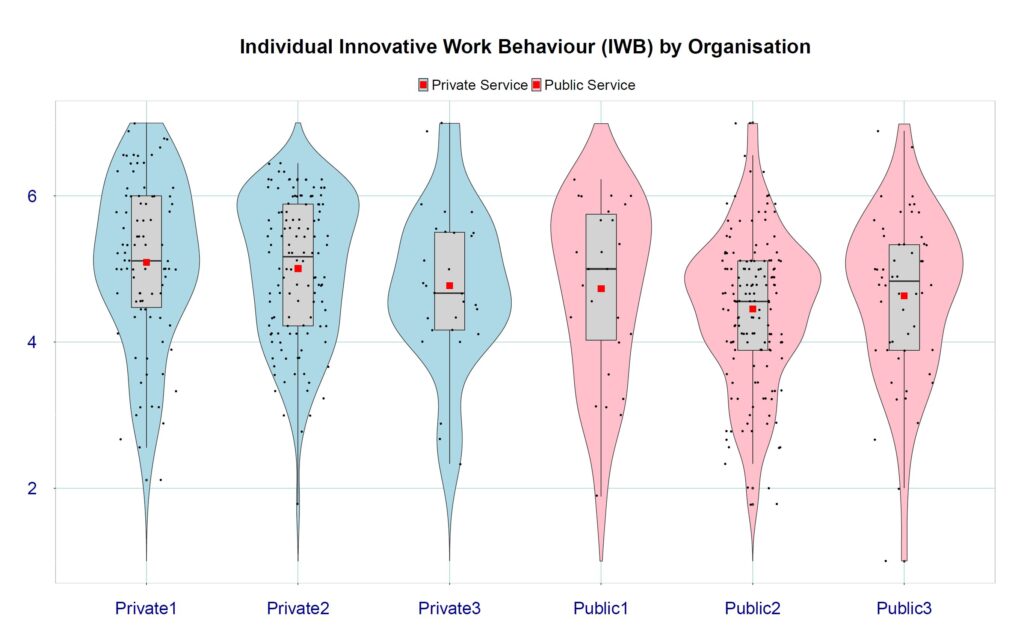
Data Analytics with R: Code and Results
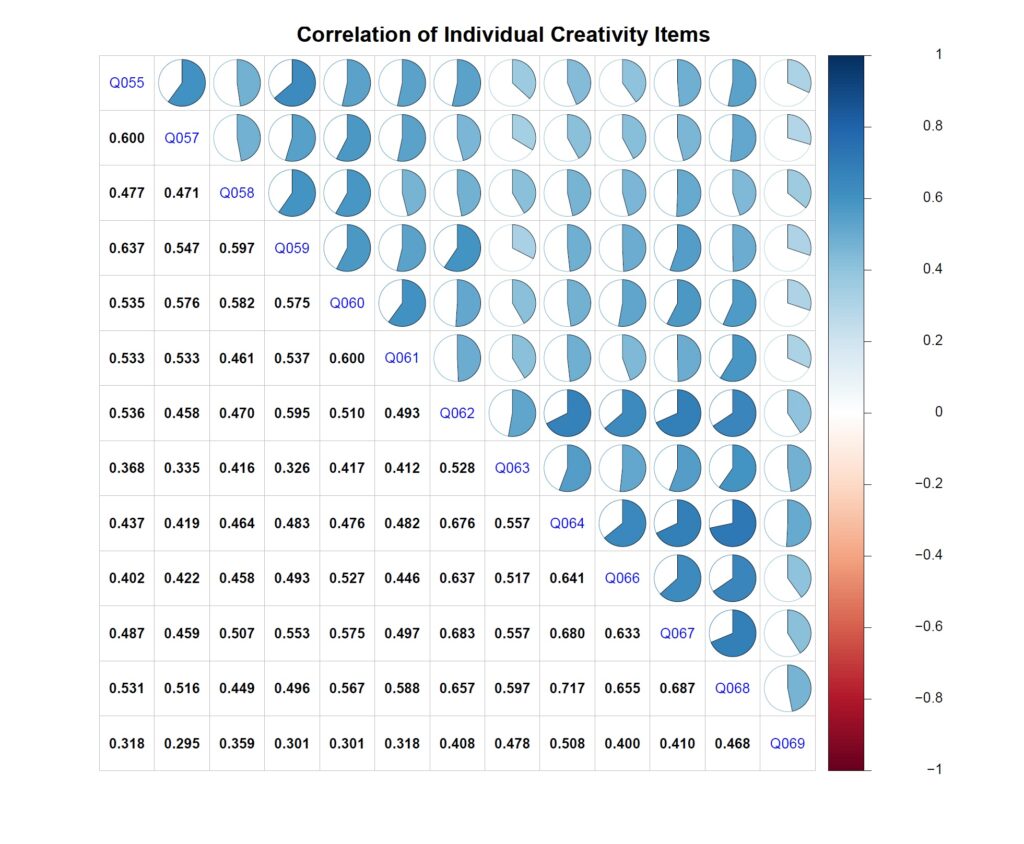
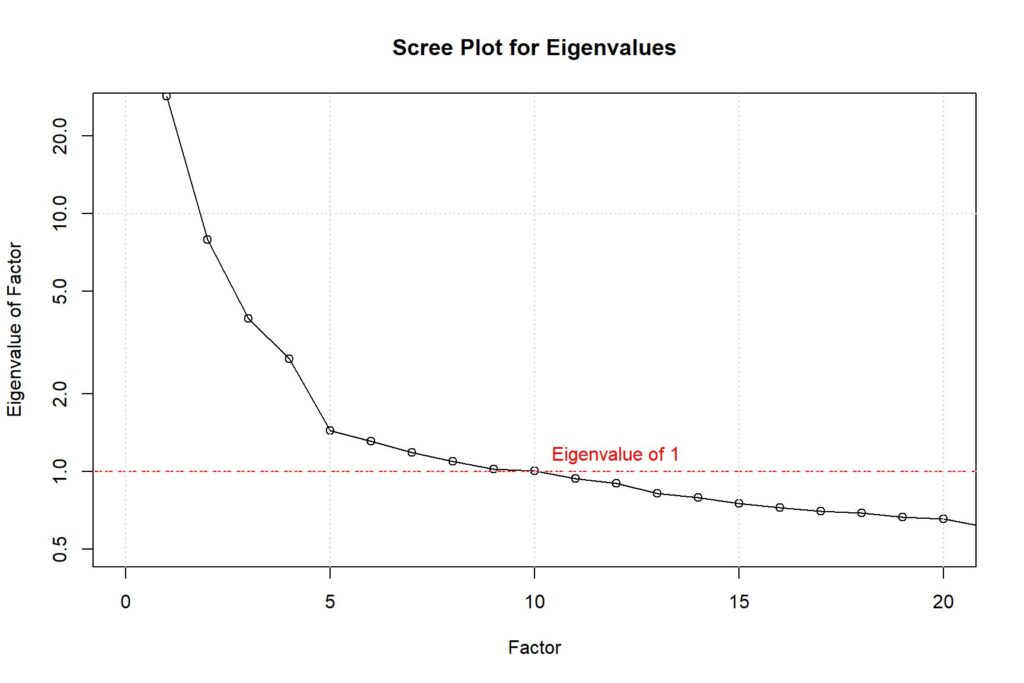
Especially when analysing survey data, understanding clusters of rating results, i.e., clusters of similar behaviours belong to the same factor. Finding these factors is an important part of research either to explore new models (Exploratory Factor Analysis – EFA) or to confirm whether the new data fit an existing model (Confirmatory Factor Analysis – CFA).
R is well equipped to support these and many other research tasks with Lavaan and other free packages.
Data Analytics with R: Code and Results
In order to understand the working mechanism of different factors such as Leadership Style (TFL), Support for Innovation (SFI), Individual Innovation Readiness (IIR) and their effect on Innovative Work Behaviour (IWB), structural equation modelling (SEM) can be deployed.
Data Analytics with R: Code and Results
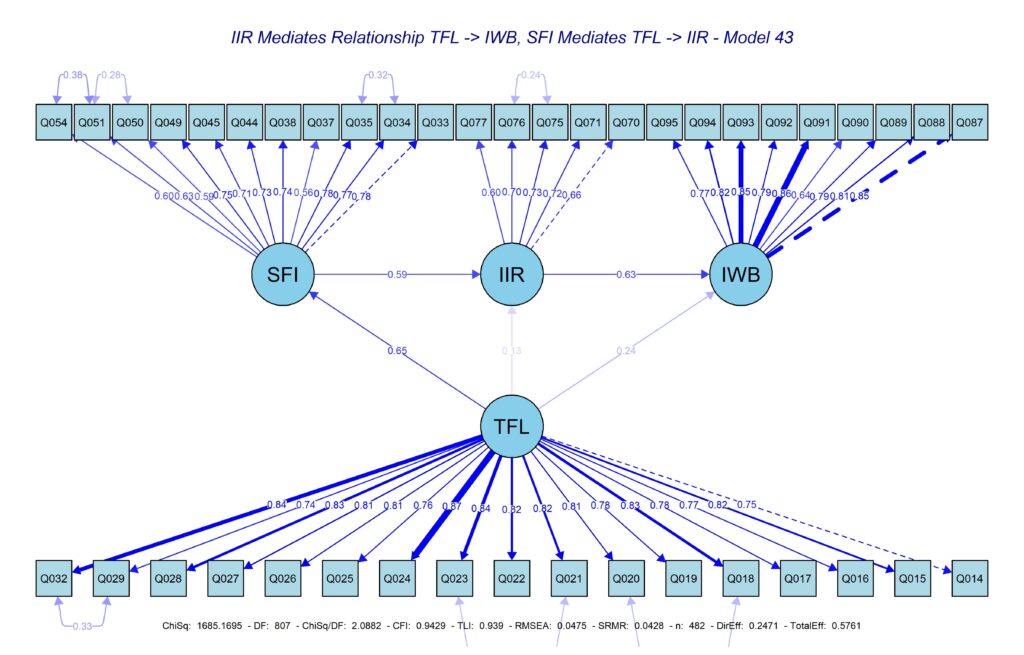
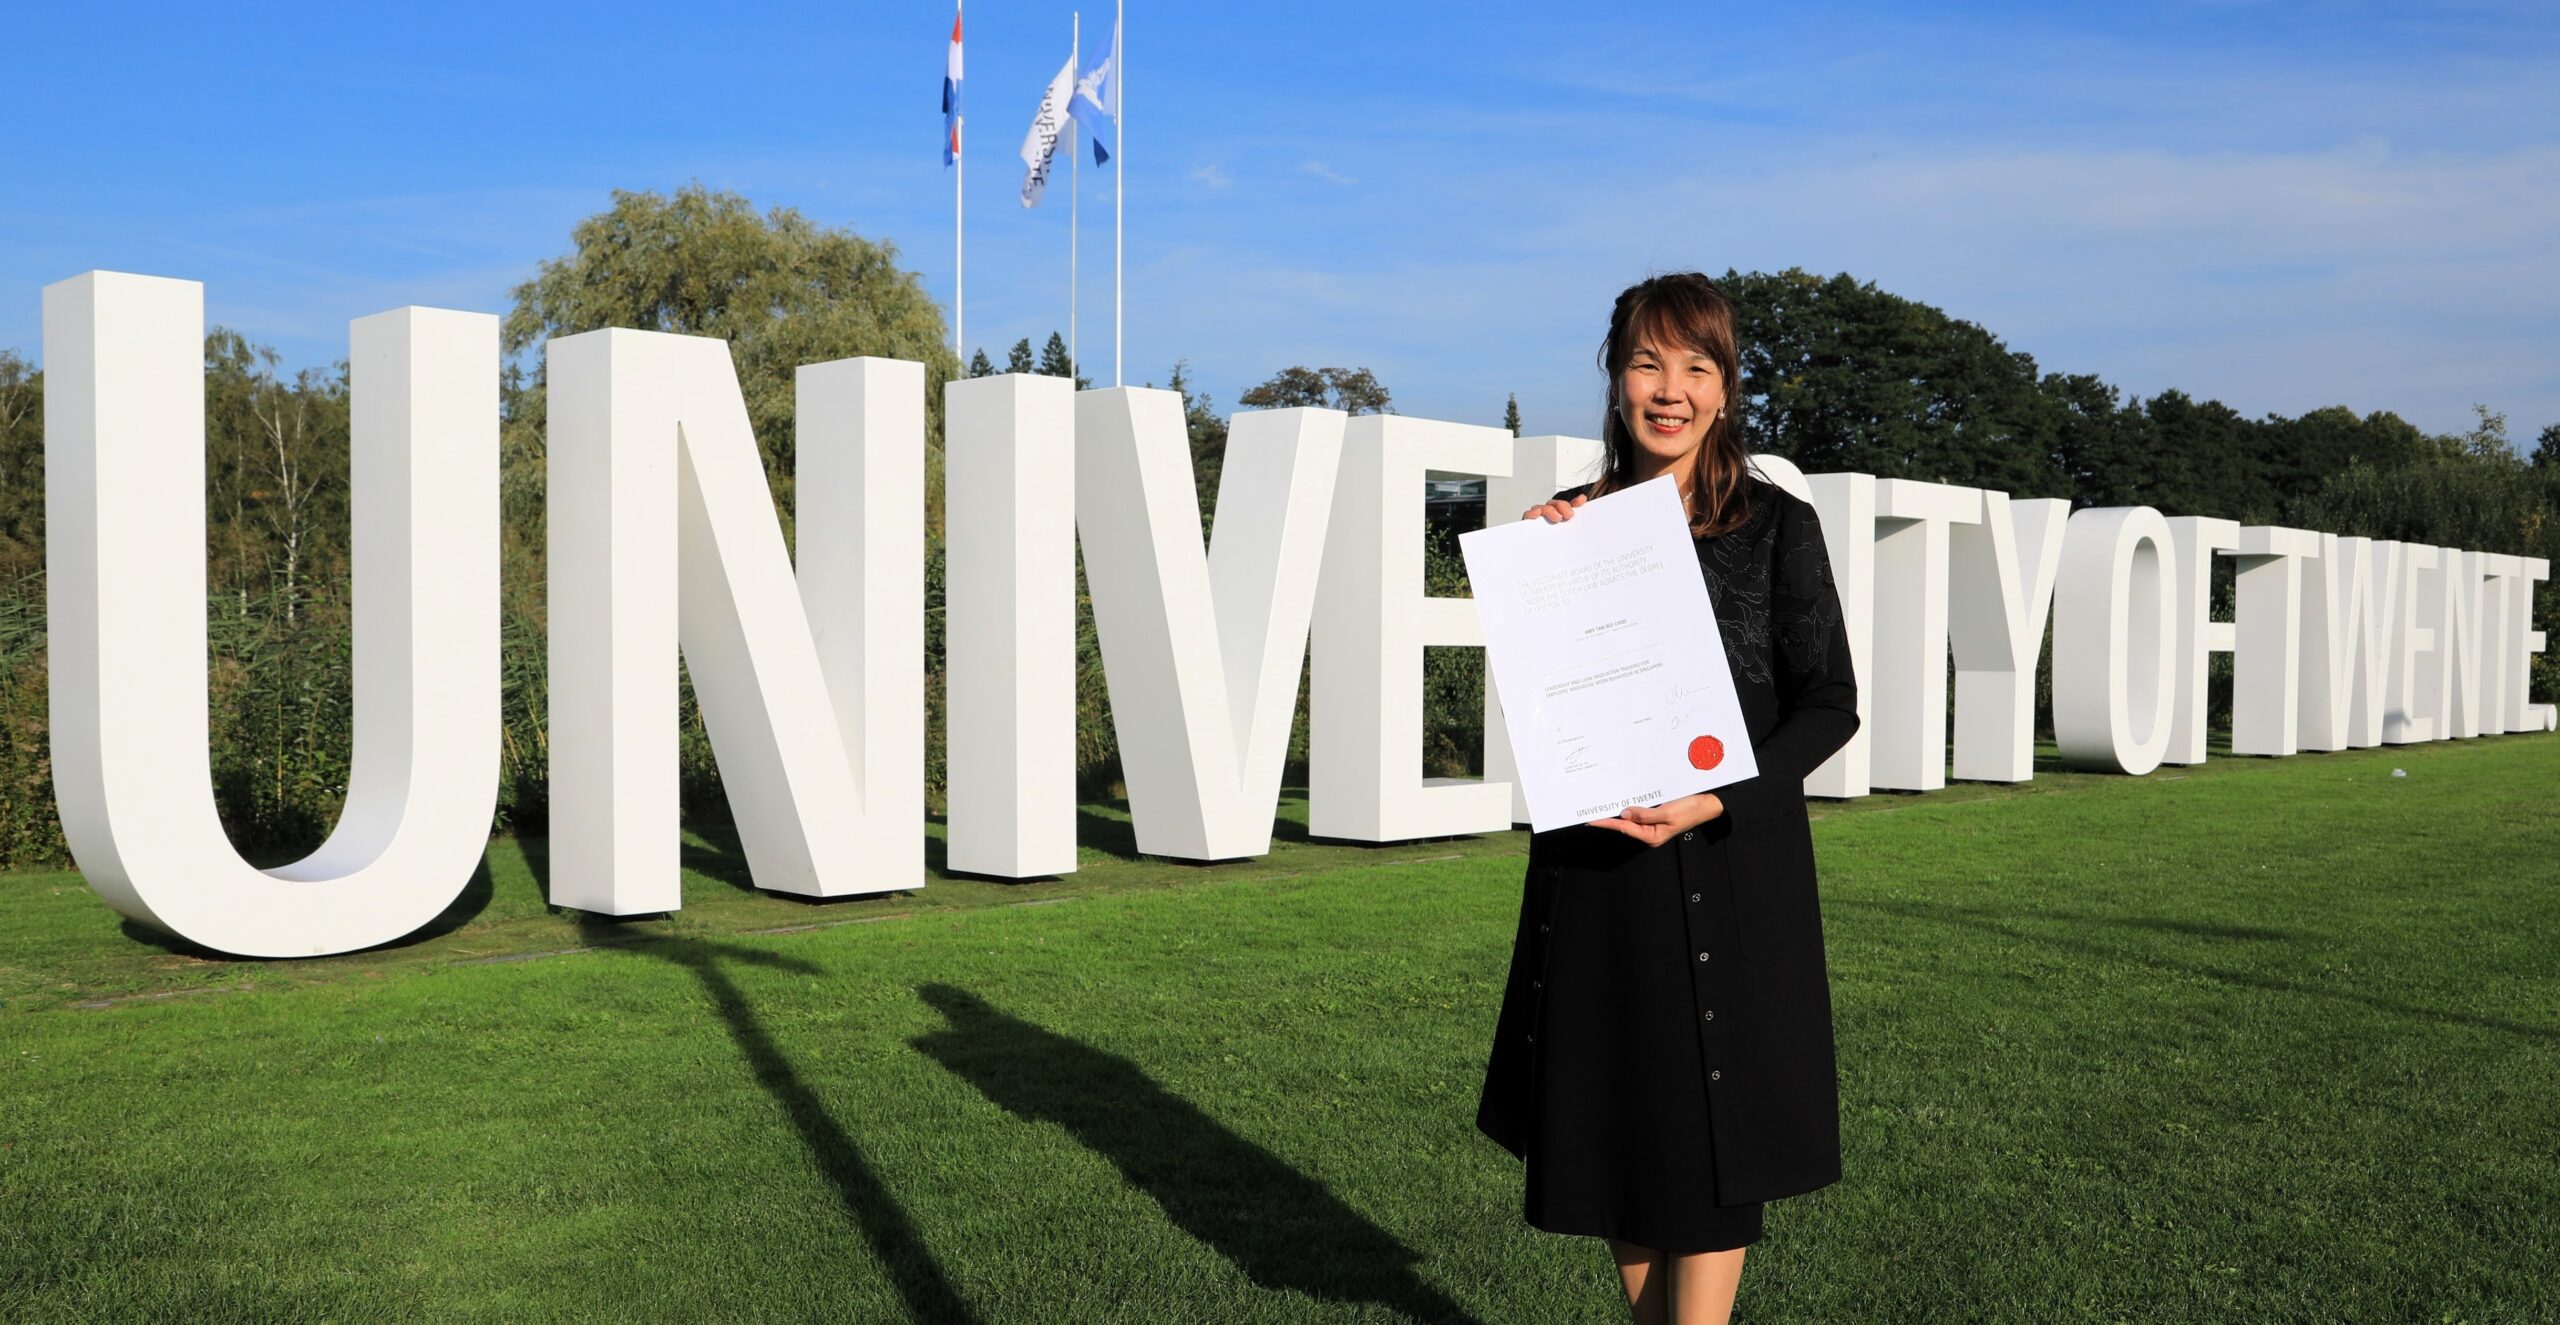
This analysis package is part of a research project with the University of Twente, The Netherlands. Read more about the study on Innovative Work Behaviour that includes the Data Analytics with R shown above.
More examples of Data Analytics with R can be found here.
Data analytics with R and RStudio is an easy way to overcome high costs for powerful analysis tools. We have performed rather complex analysis with R as shown above. There are practically no limitations to your research when you choose this environment.
And, whenever you have questions or look for a workshop to implement Data Analytics with R, talk to us (+65 6100 0263). Our partners, SUTD and SMU will help to design a package that suits your needs.




Copyright © 2026 by COE Pte Ltd. All Rights Reserved.