Requirements for customers listed earlier can be collected in many different ways. The available tools are for either reactive customer data or for proactive customer data. Reactive channels for gathering information about customer requirements include complaints, customer feedback, help desk enquiries, product or service defect numbers etc. Proactive channels include interviews, observations – the so-called Gemba visits, Mystery Shopping and customer surveys.
Reactive channels are on the one hand very cheap. The information often comes for free. On the other hand, this information is usually quite detailed and often actionable. Therefore, it is key to centralise collection and analysis of all customer requirements that come in over reactive channels. Customer complaints or customer feedback is usually very rich in details because it is given after a customer got in touch with one of our processes during the so-called „Moment of Truth“. Hence, this customer is able to and normally does describe exactly what happened under which circumstances that caused him to raise a complaint or give feedback. Reactive channels deliver useful information about issues that already happened. This information is given by the customer and might be somewhat biased.
Proactive channels for gathering information about customer requirements are often more cost intensive. It is the nature of proactive channels that customers are surveyed or interviewed without a need from the perspective of the customer. This might lead to reduced interest of the customer in the survey and less care in answering questions. Hence, the quality of information given by surveyed or interviewed customers is lower than information collected via reactive channels. Additionally, the response rate of surveys is usually quite low, because customers do not see a need to participate, consider it a waste of time due to a lack of benefit for them.
Nearly all service providers conduct surveys on a regular basis. The frequency ranges from multiple times per year to once in a few years. In order to receive less biased data, they task market research companies with the data collection and analysis. This approach offers the benefit of benchmarking that is frequently proposed by these companies. However, this way of data collection is very expensive and usually a one-way street. There is often no way to ask follow up questions after completing the survey. Therefore, a combination of multiple tools is the preferred way of gathering customer requirements.
Reactive channels only allow gathering information about existing products and services. Proactive channels do allow, either implicitly or explicitly, testing of new product or service ideas and their acceptance in the market.
Firstly, existing data about customer requirements need to be studied to decide whether they can be used for the project at hand. I.e. does this existing data allow conclusions about customer requirements for the customer segments listed earlier?
Existing data are hardly detailed enough and usually not collected for the purpose of the analysis. Therefore, this data is usually not enough for a successful project. Additional data collection needs to be tailored for industry, customer segment, project scope and other factors that may put requirements on the data to be gathered. Data collection often includes surveys followed by a series of interviews or focus group sessions. If possible, Gemba visits may give additional information about the perception of the product or service in the market.
For end consumers like banking customers, interviews are impractical due to the sheer number of customers and the small sample size offered by interviews. Surveys are more appropriate means to gather data from this type of customer. These surveys can be supported by observations, i.e. Gemba visits. Due to the high throughput of customers through the process, many data points can be collected in relatively short time windows.
For business customers like dealers, focus group interviews are best suited to support data gathered during regular surveys. Business customers are much more likely to willingly spend time for giving feedback that can be used for improving the business since the benefit for them is very apparent.
After collecting data about customer requirements, a huge amount of unstructured customer requirements in different forms might be available that needs to be structured. A relatively easy way for structuring this large amount of data is offered by the affinity diagramme in conjunction with a tree diagramme .
An affinity diagramme helps to categorise large amounts of data. It is preferred if the data to be categorised is of qualitative type. Qualitative data are harder to handle because of the potential ambiguity of this type of data. An affinity diagramme has to be used in a team. Its effectivity is based on knowledge, experience and creativity of team members. At the same time, the affinity diagramme supports team work and helps strengthen the team.
An affinity diagramme of customer requirements is build the following way:
1. Each customer input is written on an index card or a sticky note.
2. Together, team members add note by note whilst trying to group them by topic or theme, i.e. related notes are grouped together so that multiple clusters are created. In order to speed up this process and avoid long-lasting disputes about relationships between notes, this step can be done quietly, i.e. without talking. If team members cannot agree on a category for one or more notes, they may be added to multiple clusters.
3. At the end, clusters receive headlines, i.e. with topic names that represent all or most of the notes in this cluster.
When creating an affinity diagramme it is not necessary to have a similar number of notes in each group. It might be that some groups carry only a few or only one note. The number of notes in the group can be seen as an indicator for the weight of this cluster.
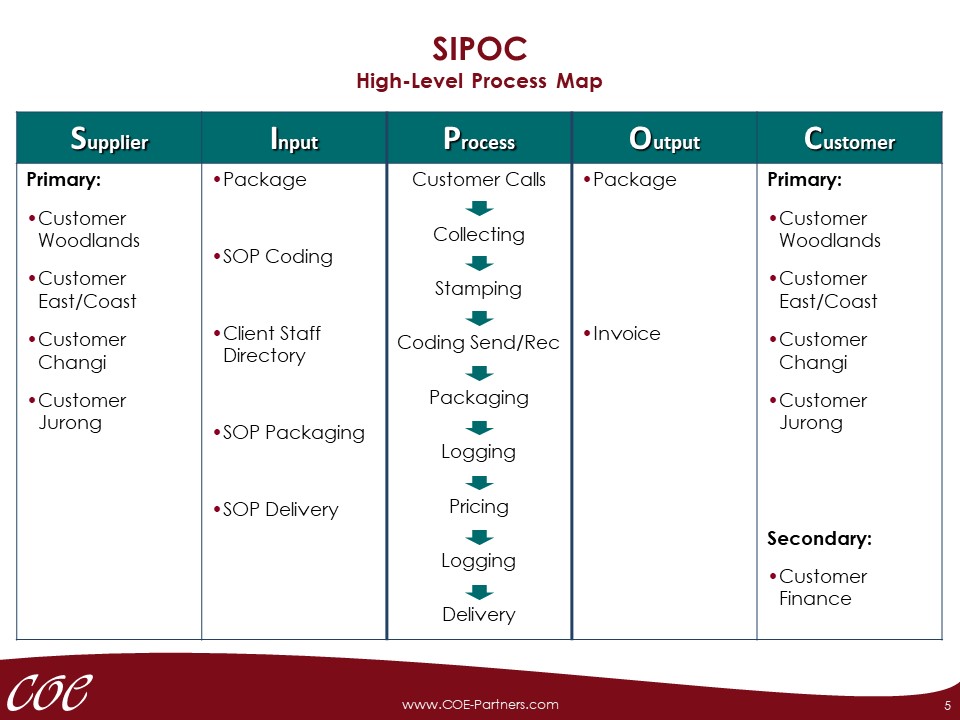
After completing the affinity diagramme, the groups of customer requirements are structured and translated into process indicators. I.e. it is necessary to identify process indicators that are able to represent these customer requirements.
A tree diagramme or CTQ tree (critical to quality tree) is used to break down customer requirements as far as necessary to be able to attach process indicators that represent all aspects of the customer needs. This step is vital since customer requirements are usually put across in the voice of the customer that is not specific enough for process improvement, and not measurable.
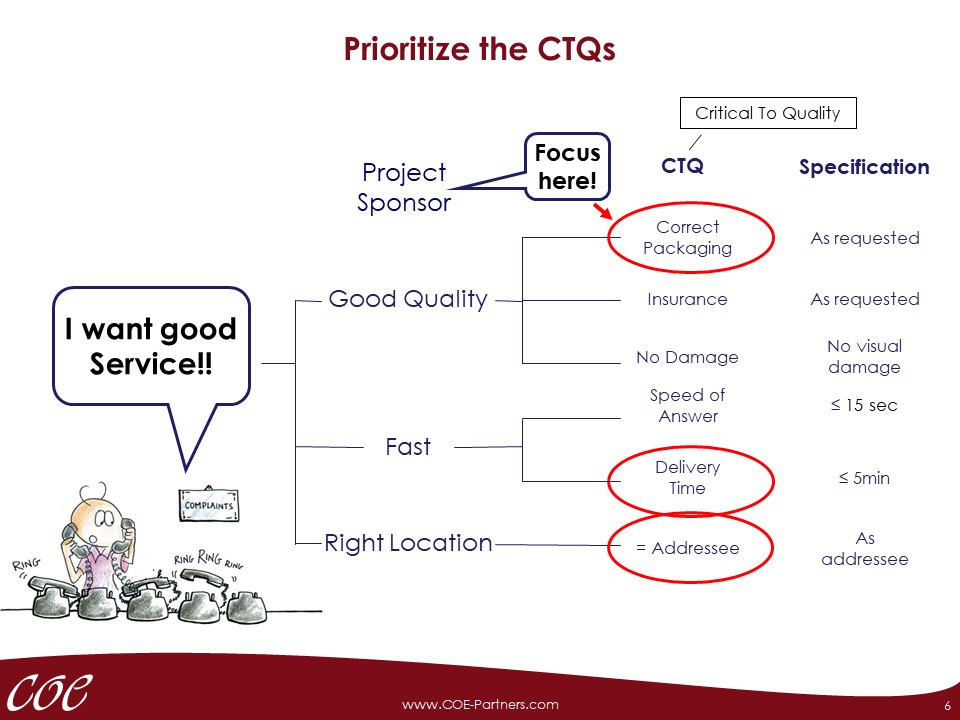
For example, a customer requirement “I want good service” represents a typical customer statement. However, it does not say what the customer means by that and it is therefore not measurable.
A CTQ tree diagramme of customer requirements is build the following way:
1. Each group in the affinity diagramme represents a branch in the tree diagramme. In our example “good quality” is one of these branches. It is not possible to measure degree of meeting this requirement because it is not specific enough.
2. For each group, drivers need to be identified out of the cluster in the affinity diagramme. These drivers are also put in the voice of the customer. They are shown to the right of the main branch. In our example, “correct packaging”, “insurance coverage” and “no damages” are identified supporting this branch. These statements are subjective as well.
3. Out of these drivers, another level of sub-drivers can be established. In our example, the next step is to derive measurable process indicators, critical to quality (CTQ ), for the drivers. For example, “correct packaging” translates into “as requested in SOP”.
4. In another step, the targets for these indicators need to be set. They can come from benchmarking studies, from customer feedback or from internal decisions based on the experience with this process.
The tree diagramme is completed after all drivers have measurable indicators attached. For business to business customers, the completion of this step can be verified through a focus group session with some key customers of this process. For end consumers, this is usually not possible.
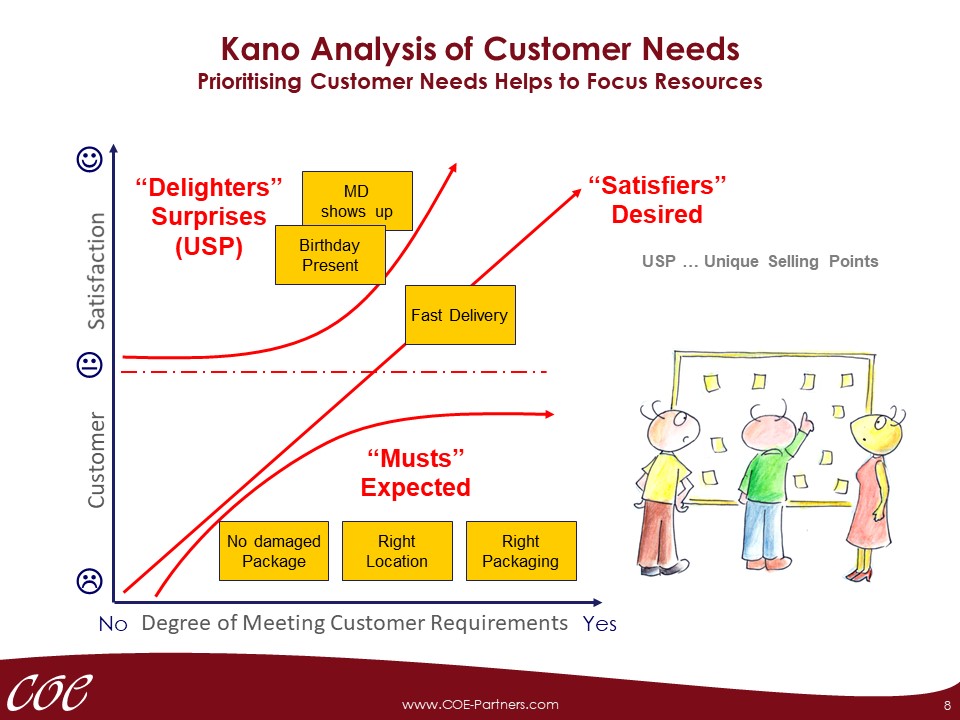
The Kano diagramme is a qualitative tool that helps prioritising customer requirements. This diagramme shows the relationship of customer satisfaction to degree of meeting customer requirements. Customer requirements appear in three categories: musts, satisfiers and delighters (Figure 7).
Musts are customer needs that always need to be met because customers assume they are provided, often without mentioning them. If these characteristics are not offered, customers will certainly be dissatisfied. However, offering these characteristics does not mean customers are satisfied. They may not even recognise that these characteristics are offered. For example, a bank has to have ATMs. Having an ATM does not lead to customer satisfaction, but customers would not understand if a bank does not offer ATM services, hence not having an ATM certainly raises complaints by customers.
Satisfiers, or the more the better characteristics, are customer needs with a near linear effect on customer satisfaction. Not offering satisfiers will lead to customer dissatisfaction. Offering satisfiers to a certain degree leads to a certain level of satisfaction. Offering satisfiers to a very high degree may lead to delighted customers. For example, long waiting time at banking counters leads to dissatisfaction, whereas some minutes would be acceptable. If the waiting time is closed to zero continuously, the customer would be satisfied or even positively surprised.